30
/
AIzaSyAYiBZKx7MnpbEhh9jyipgxe19OcubqV5w
April 1, 2024
32409
Europe & Central Asia (IDA & IBRD countries)
TEC
false
2
1
Average transaction cost of sending remittances to a specific country (%)
2016,2015,2014,2013,2012
Download
Global statistics library →Europe & Central Asia (IDA & IBRD countries) →

Average transaction cost of sending remittances to a specific country (%)

This statistics in other country:

AfghanistanAlbaniaAlgeriaAngolaArab WorldArmeniaAzerbaijanBangladeshBelarusBoliviaBosnia and HerzegovinaBotswanaBrazilBulgariaCabo VerdeCambodiaCameroonCaribbean small statesCentral Europe and the BalticsChinaColombiaCongo, Rep.Costa RicaCote d'IvoireCroatiaDominican RepublicEarly-demographic dividendEast Asia & Pacific (excluding high income)East Asia & Pacific (IDA & IBRD countries)EcuadorEgypt, Arab Rep.El SalvadorEritreaEstoniaEthiopiaEurope & Central AsiaEurope & Central Asia (excluding high income)Europe & Central Asia (IDA & IBRD countries)FijiFragile and conflict affected situationsGambia, TheGeorgiaGhanaGuatemalaGuyanaHaitiHeavily indebted poor countries (HIPC)HondurasHungaryIBRD onlyIDA & IBRD totalIDA blendIDA onlyIDA totalIndiaIndonesiaJamaicaJordanKazakhstanKenyaKiribatiKorea, Rep.KosovoKyrgyz RepublicLao PDRLate-demographic dividendLatin America & Caribbean Latin America & Caribbean (excluding high income)Latin America & the Caribbean (IDA & IBRD countries)LatviaLeast developed countries: UN classificationLebanonLesothoLiberiaLithuaniaLow & middle incomeLow incomeLower middle incomeMacedonia, FYRMadagascarMalawiMalaysiaMaliMexicoMiddle East & North Africa (excluding high income)Middle East & North Africa (IDA & IBRD countries)Middle incomeMoldovaMoroccoMozambiqueMyanmarNepalNicaraguaNigeriaPakistanPanamaPapua New GuineaParaguayPeruPhilippinesPolandPre-demographic dividendRomaniaRwandaSamoaSenegalSerbiaSierra LeoneSolomon IslandsSomaliaSouth AfricaSouth AsiaSouth Asia (IDA & IBRD)Sri LankaSub-Saharan Africa Sub-Saharan Africa (excluding high income)Sub-Saharan Africa (IDA & IBRD countries)SudanSurinameSwazilandSyrian Arab RepublicTajikistanTanzaniaThailandTogoTongaTunisiaTurkeyTuvaluUgandaUkraineUpper middle incomeUzbekistanVanuatuVietnamWorldYemen, Rep.ZambiaZimbabwe

Timeline:

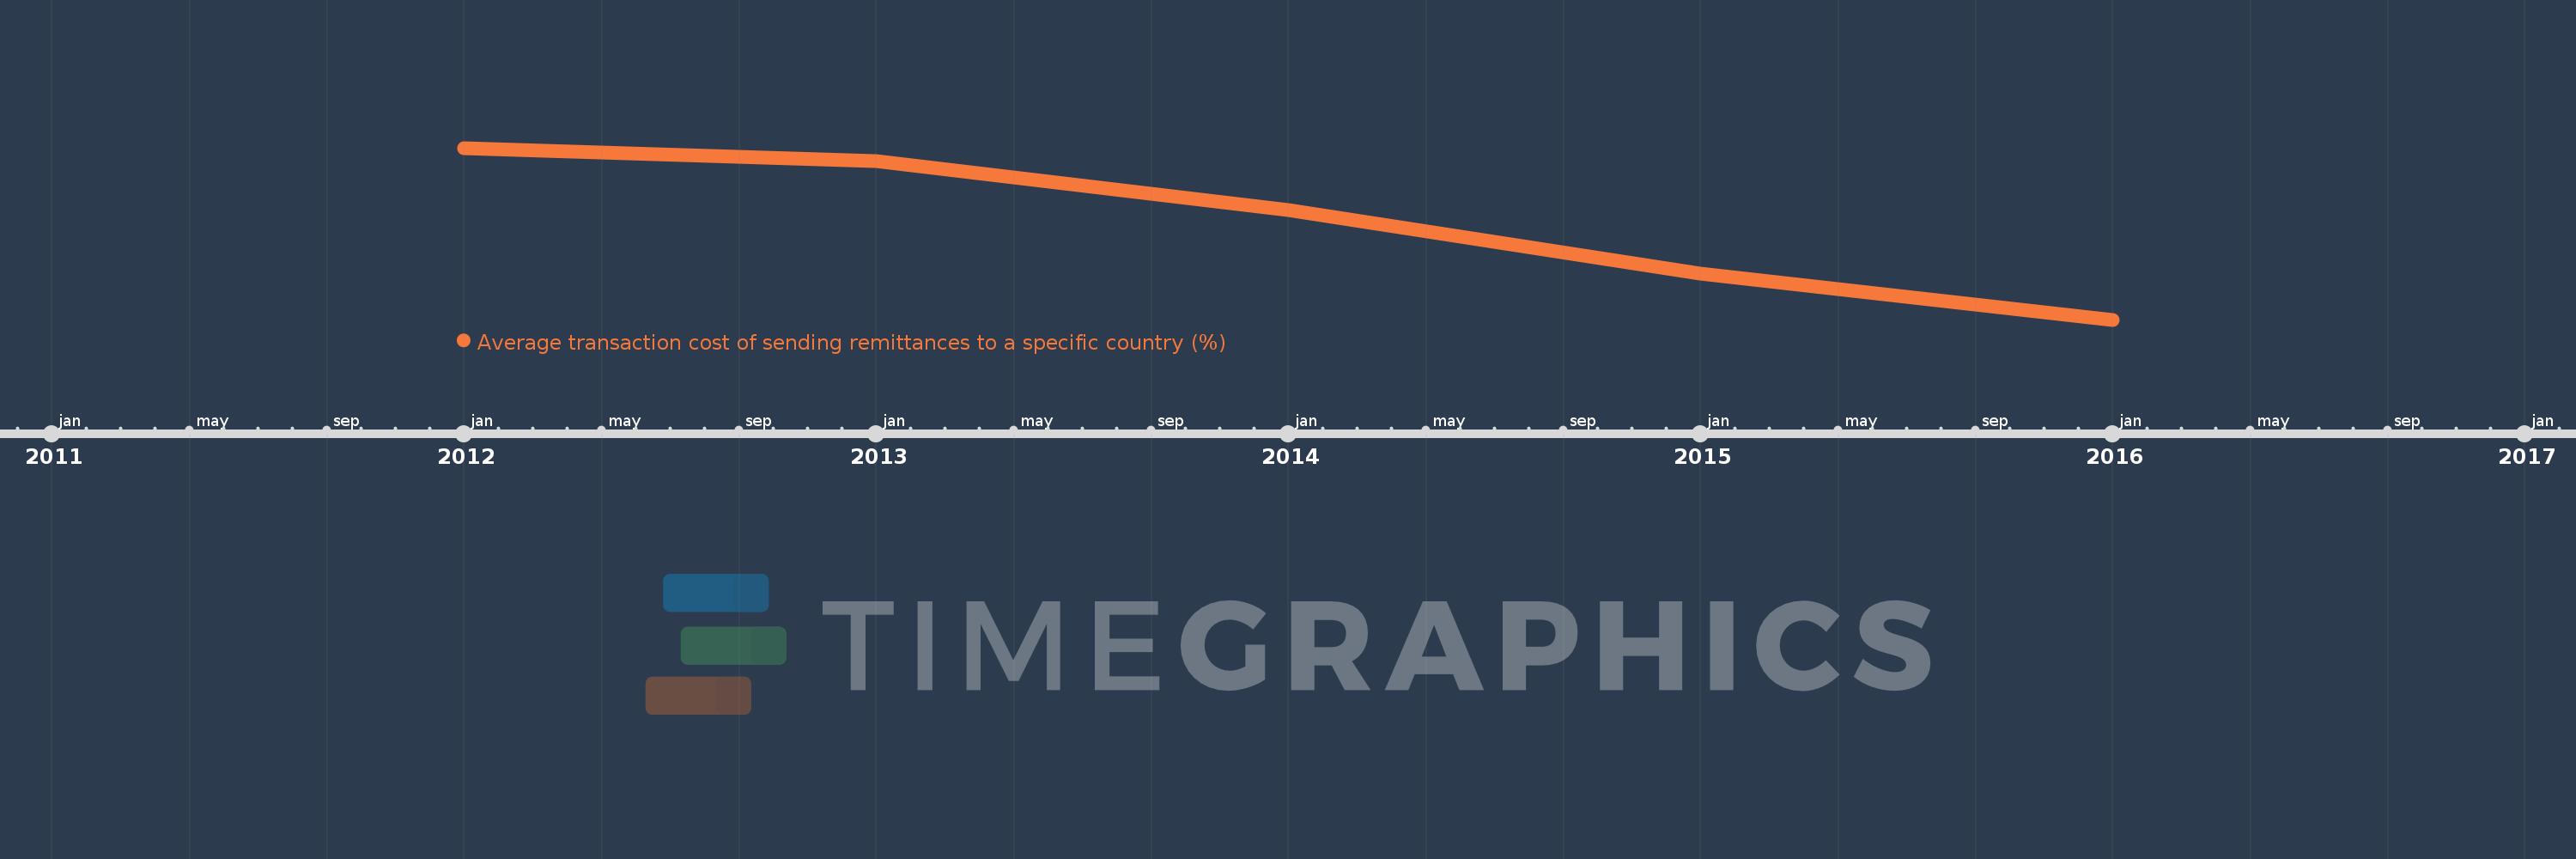
This timeline shows a graph from 2012 to 2016 of Europe & Central Asia (IDA & IBRD countries). No data until 2011. Number of actual observations by date: 5.

Source name:

World Development Indicators

Source organization:

World Bank, Remittance Prices Worldwide, available at http://remittanceprices.worldbank.org

Categories, topics:

Financial Sector

Last updated:

apr 23, 2017

Indicators value changes by year

Meaning:
5.799
Minimum:
5.152
jan 1, 2016
Maximum:
6.294
jan 1, 2012
At the date of observation
Value
Absolute change
Change from the previous value
jan 1, 2012
6.294
+6.294
0.0%
jan 1, 2013
6.208
-0.086
-1.37%
jan 1, 2014
5.883
-0.325
-5.24%
jan 1, 2015
5.458
-0.425
-7.23%
jan 1, 2016
5.152
-0.306
-5.6%

Ranking of countries by current statistics by years