Download This statistics in other country:
Timeline:
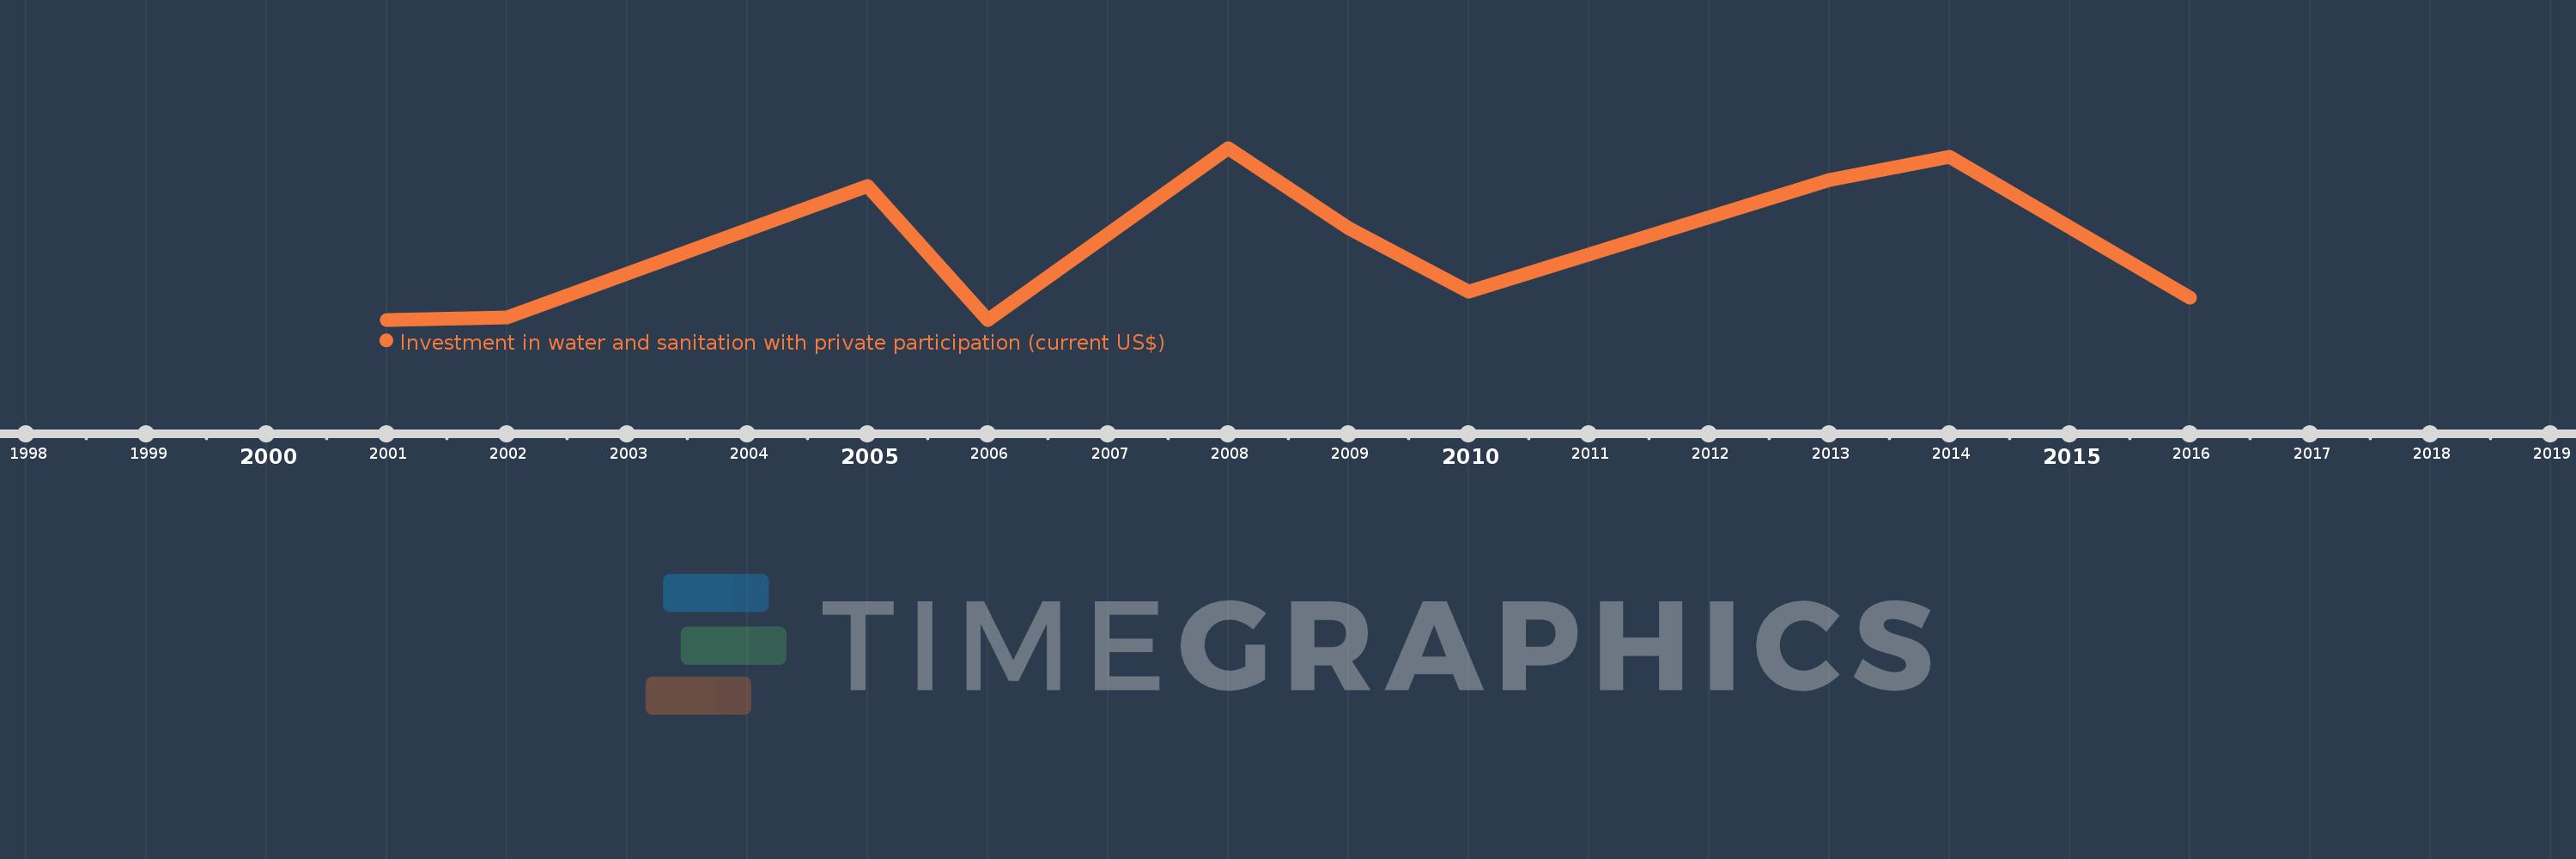
This timeline shows a graph from 2001 to 2016 of South Asia (IDA & IBRD). No data until 2000. Number of actual observations by date: 10.
Source name:
World Development Indicators
Source organization:
World Bank, Private Participation in Infrastructure Project Database (http://ppi.worldbank.org).
Categories, topics:
Infrastructure, Private Sector
Last updated:
apr 23, 2017
Indicators value changes by year
Maximum:
142.25 mln
jan 1, 2008
At the date of observation
Value
Absolute change
Change from the previous value
jan 1, 2002
2.1 mln
+2.1 mln
%
jan 1, 2005
110.75 mln
+108.65 mln
5.17K%
jan 1, 2006
0.0
-110.75 mln
-100.0%
jan 1, 2008
142.25 mln
+142.25 mln
%
jan 1, 2009
75.9 mln
-66.35 mln
-46.64%
jan 1, 2010
23.53 mln
-52.37 mln
-69.0%
jan 1, 2013
115.6 mln
+92.07 mln
391.29%
jan 1, 2014
135.1 mln
+19.5 mln
16.87%
jan 1, 2016
18.5 mln
-116.6 mln
-86.31%
Ranking of countries by current statistics by years