Download This statistics in other country:
Timeline:
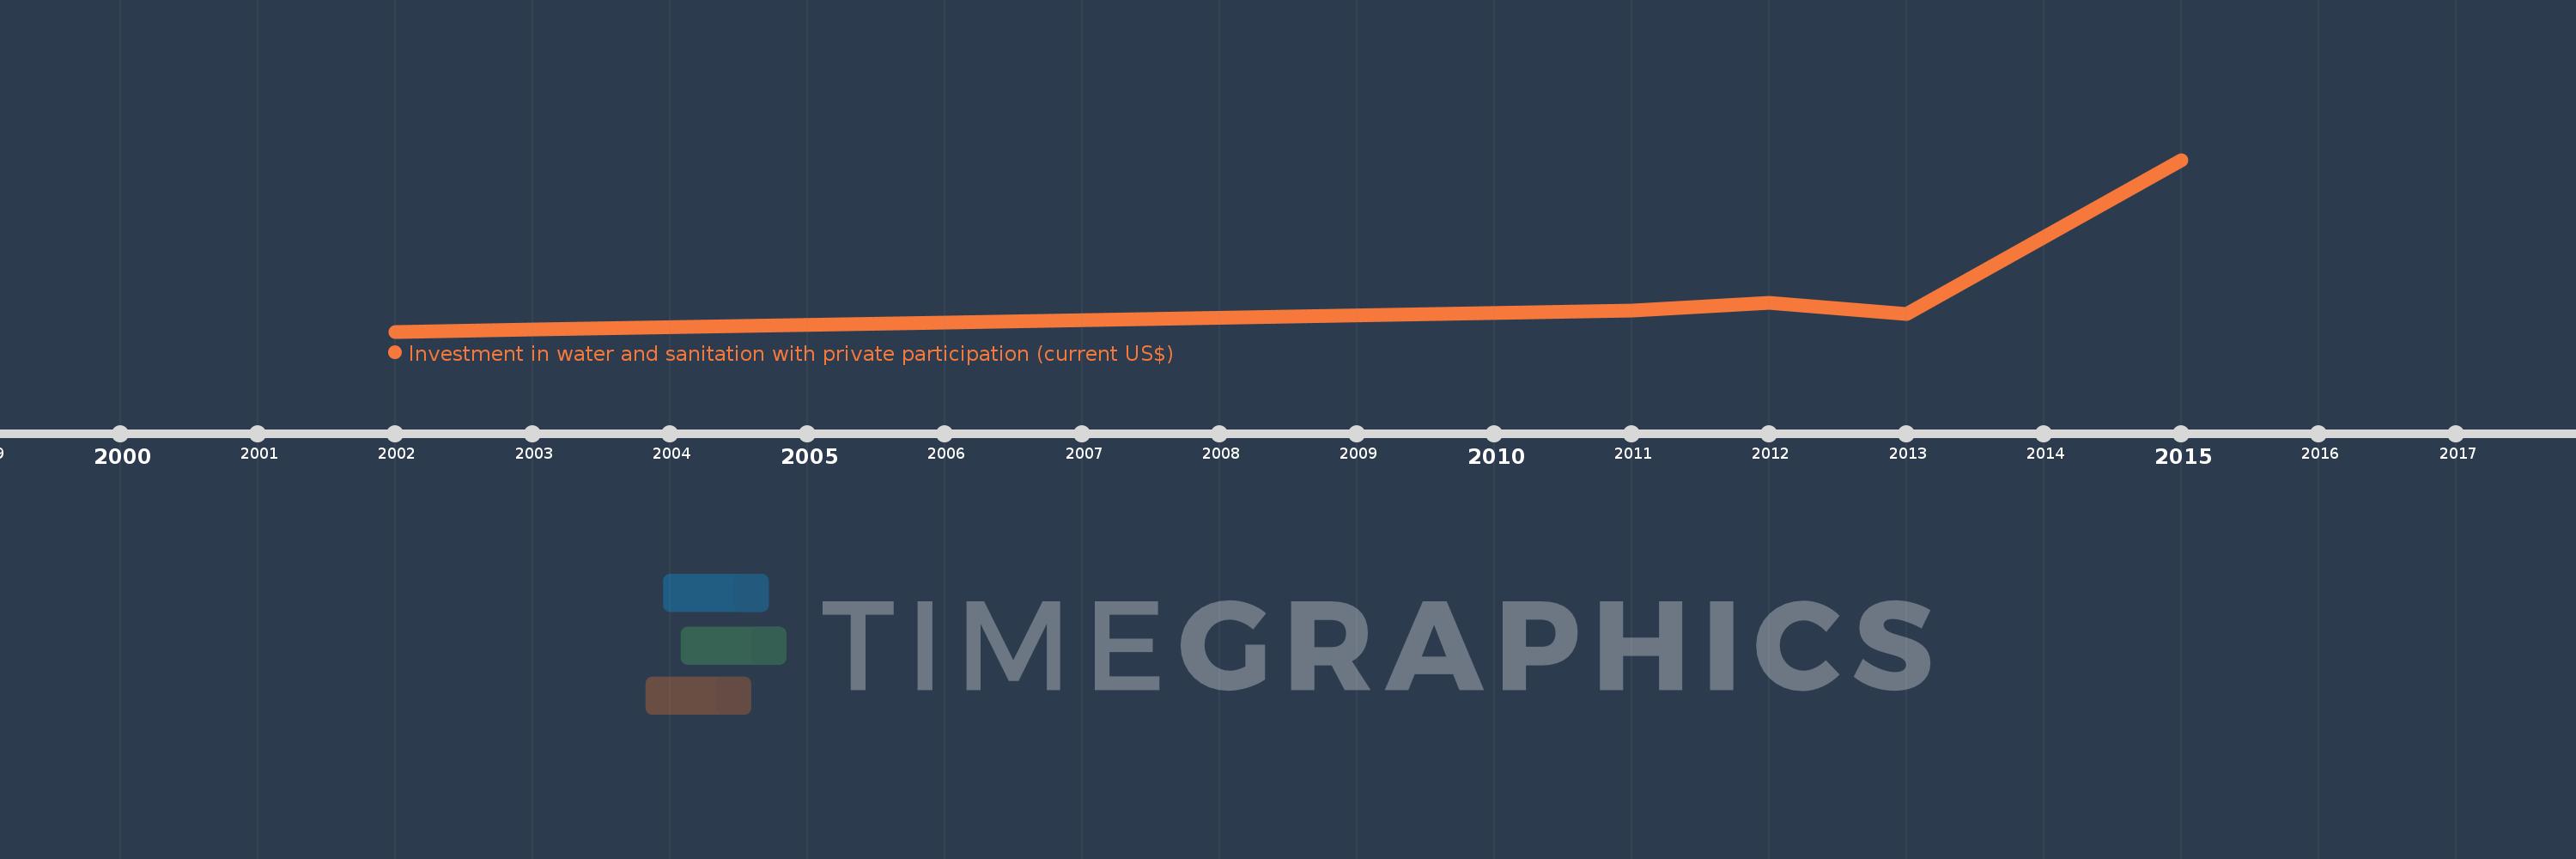
This timeline shows a graph from 2002 to 2015 of Peru. No data until 2001. Number of actual observations by date: 7.
Source name:
World Development Indicators
Source organization:
World Bank, Private Participation in Infrastructure Project Database (http://ppi.worldbank.org).
Categories, topics:
Infrastructure, Private Sector
Last updated:
apr 23, 2017
Indicators value changes by year
Minimum:
35.0 mln
jan 1, 2002
Maximum:
715.0 mln
jan 1, 2015
At the date of observation
Value
Absolute change
Change from the previous value
jan 1, 2002
35.0 mln
+35.0 mln
0.0%
jan 1, 2003
45.0 mln
+10.0 mln
28.57%
jan 1, 2006
72.0 mln
+27.0 mln
60.0%
jan 1, 2011
119.8 mln
+47.8 mln
66.39%
jan 1, 2012
149.5 mln
+29.7 mln
24.79%
jan 1, 2013
104.5 mln
-45.0 mln
-30.1%
jan 1, 2015
715.0 mln
+610.5 mln
584.21%
Ranking of countries by current statistics by years