Download This statistics in other country:
Timeline:
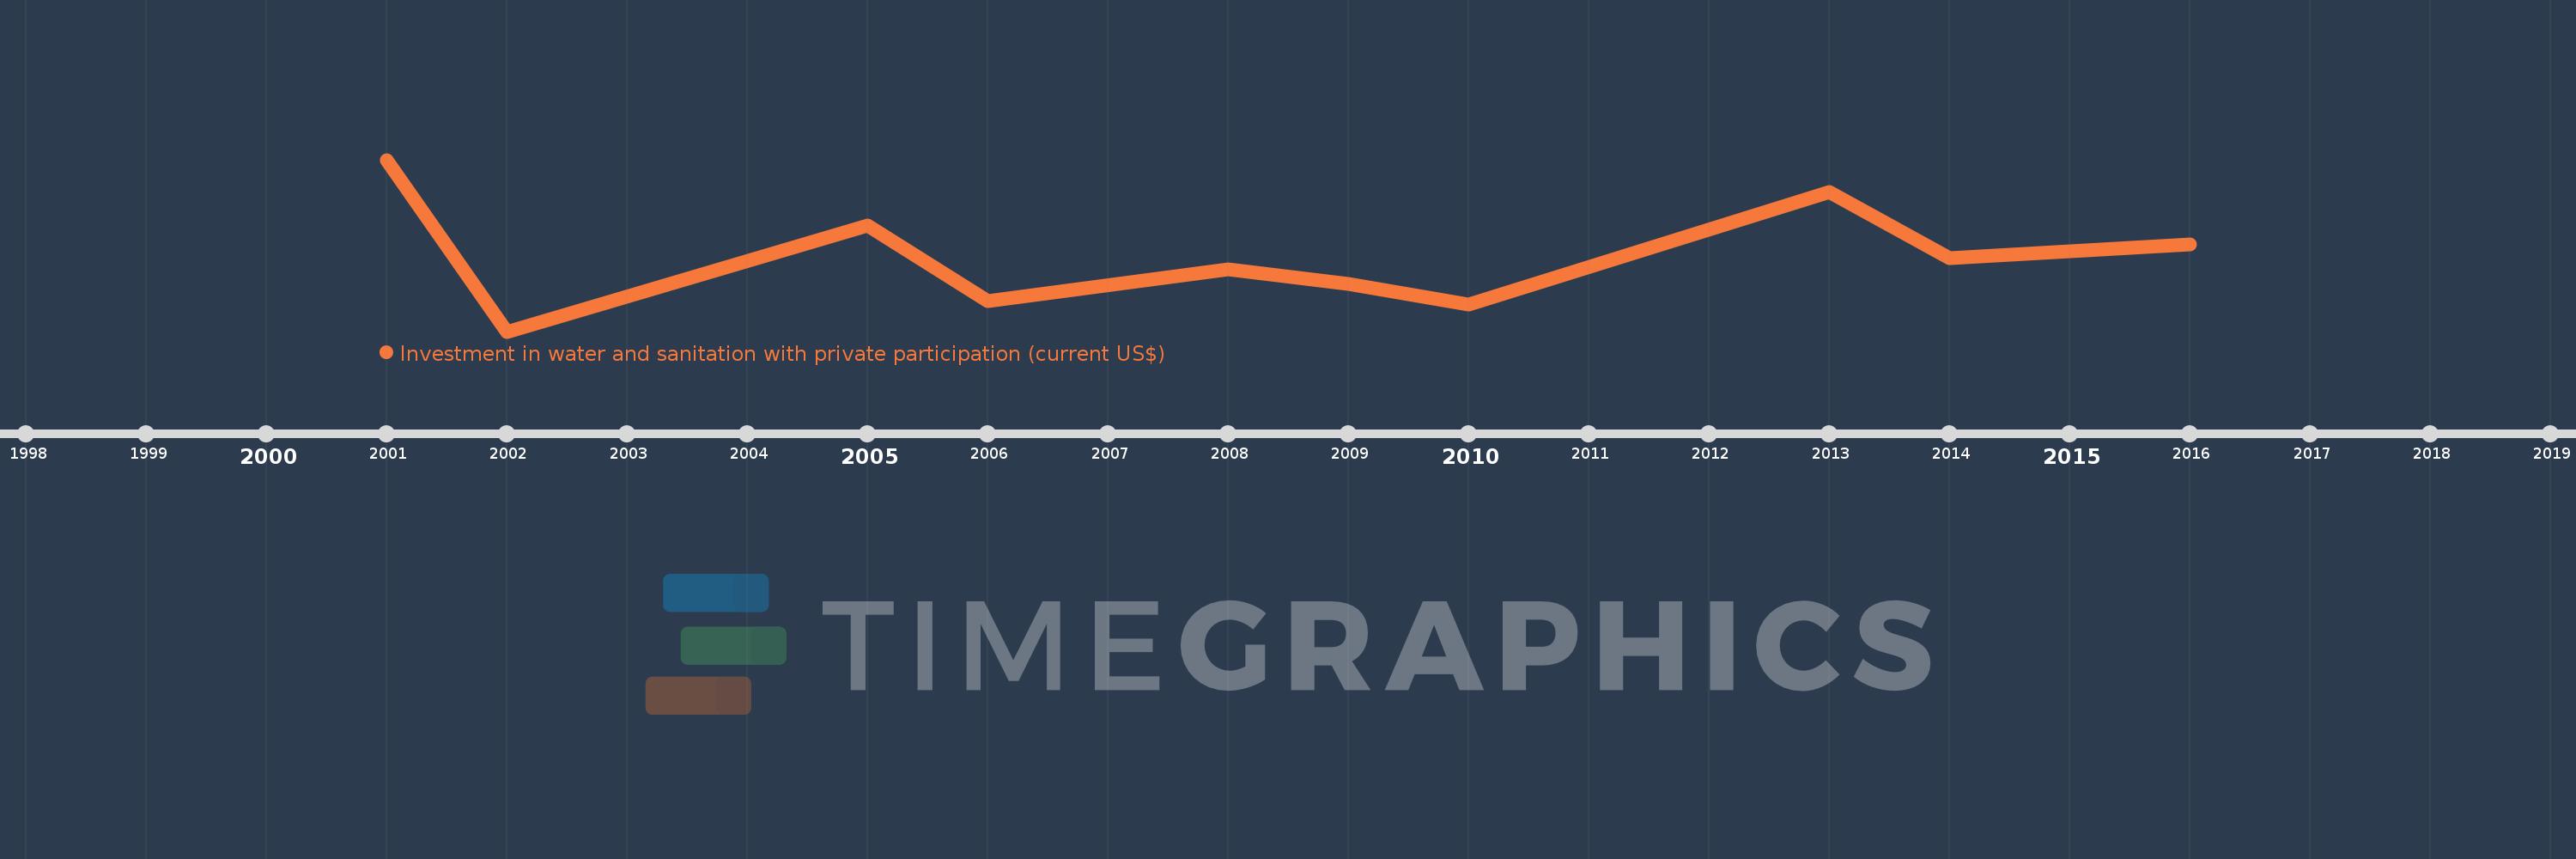
This timeline shows a graph from 2001 to 2016 of IBRD only. No data until 2000. Number of actual observations by date: 10.
Source name:
World Development Indicators
Source organization:
World Bank, Private Participation in Infrastructure Project Database (http://ppi.worldbank.org).
Categories, topics:
Infrastructure, Private Sector
Last updated:
apr 23, 2017
Indicators value changes by year
Minimum:
1.491 bln
jan 1, 2002
Maximum:
6.591 bln
jan 1, 2001
At the date of observation
Value
Absolute change
Change from the previous value
jan 1, 2001
6.591 bln
+6.591 bln
0.0%
jan 1, 2002
1.491 bln
-5.1 bln
-77.38%
jan 1, 2005
4.646 bln
+3.155 bln
211.69%
jan 1, 2006
2.391 bln
-2.255 bln
-48.54%
jan 1, 2008
3.333 bln
+942.632 mln
39.43%
jan 1, 2009
2.9 bln
-433.782 mln
-13.01%
jan 1, 2010
2.285 bln
-614.654 mln
-21.2%
jan 1, 2013
5.641 bln
+3.356 bln
146.9%
jan 1, 2014
3.659 bln
-1.982 bln
-35.14%
jan 1, 2016
4.081 bln
+422.05 mln
11.53%
Ranking of countries by current statistics by years