Download This statistics in other country:
Timeline:
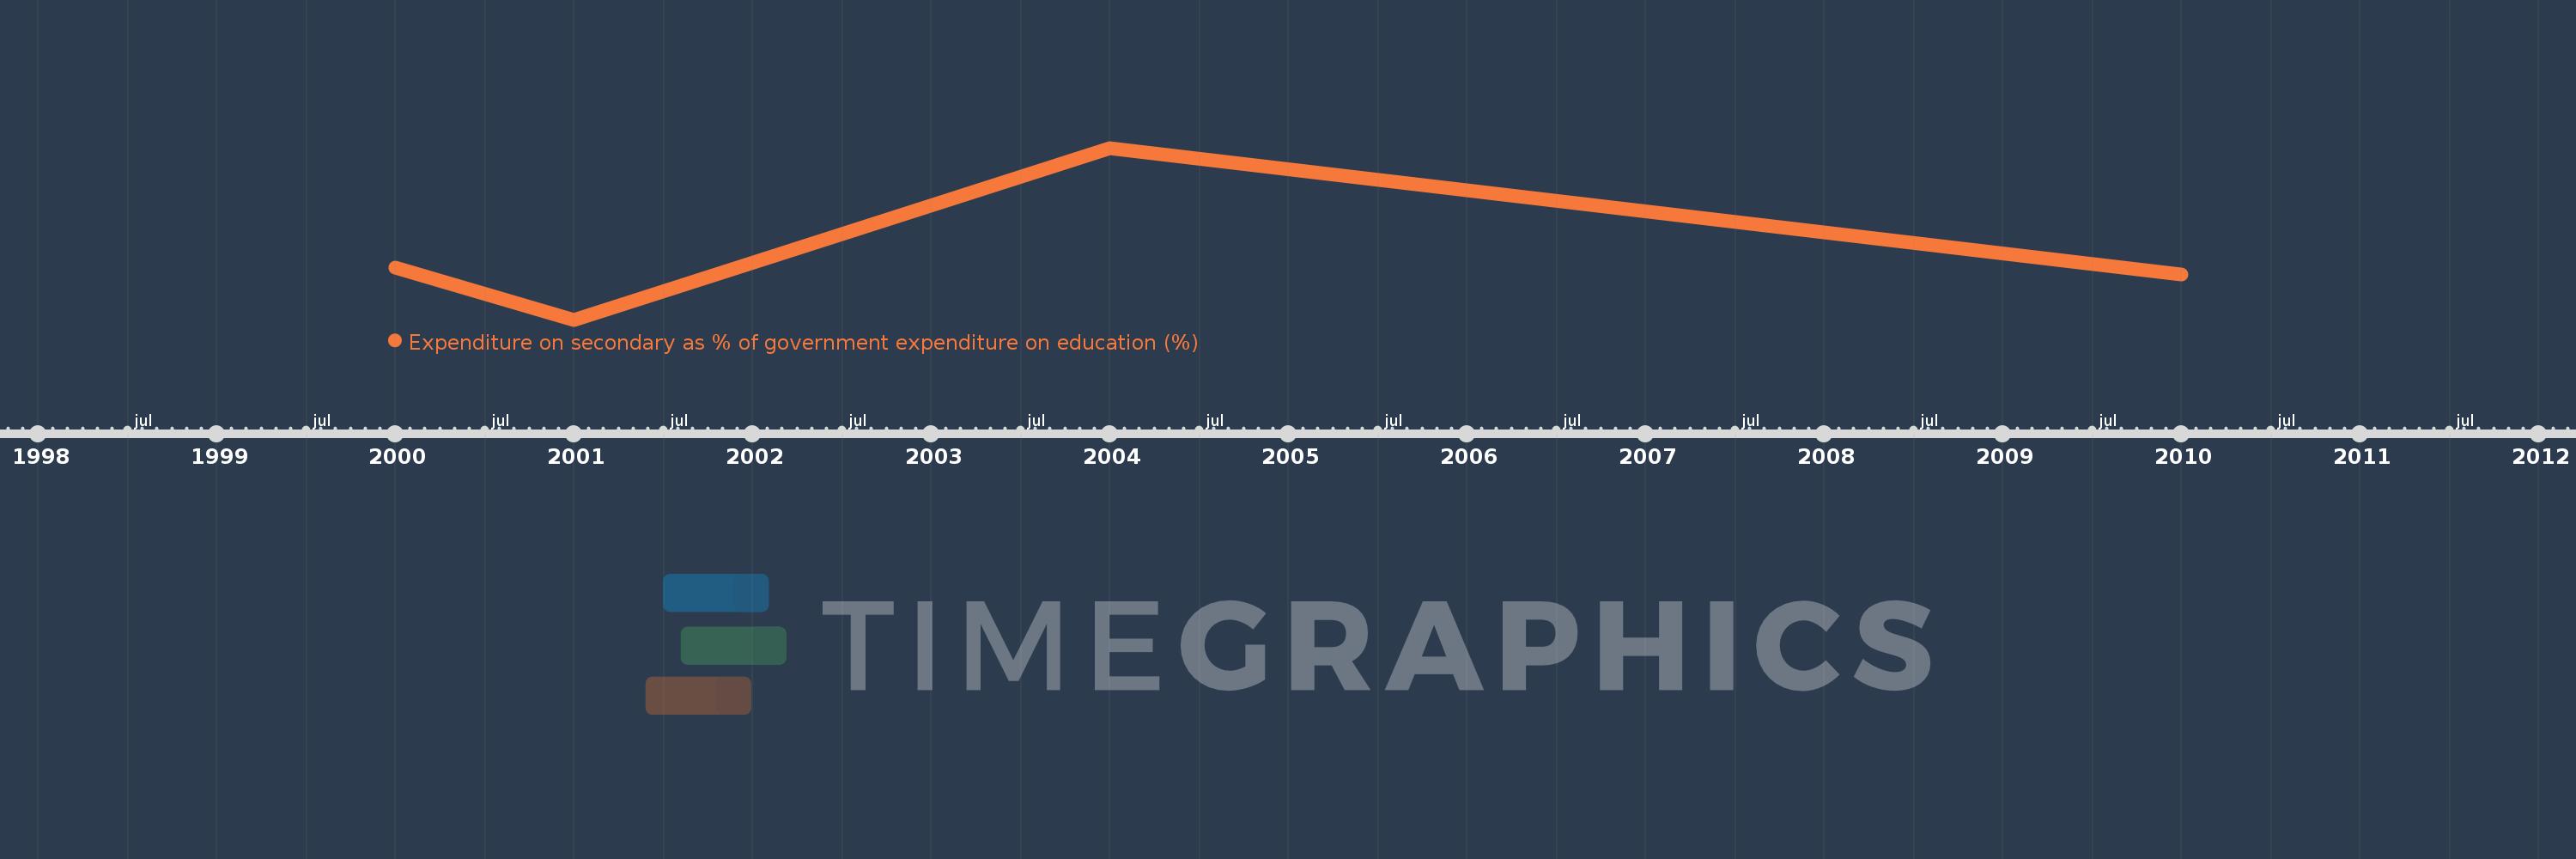
This timeline shows a graph from 2000 to 2010 of South Asia (IDA & IBRD). No data until 1999. Number of actual observations by date: 4.
Source name:
World Development Indicators
Source organization:
UNESCO Institute for Statistics
Categories, topics:
Education
Last updated:
apr 23, 2017
Indicators value changes by year
Minimum:
36.106
jan 1, 2001
Maximum:
41.666
jan 1, 2004
At the date of observation
Value
Absolute change
Change from the previous value
jan 1, 2000
37.802
+37.802
0.0%
jan 1, 2001
36.106
-1.696
-4.49%
jan 1, 2004
41.666
+5.56
15.4%
jan 1, 2010
37.562
-4.104
-9.85%
Ranking of countries by current statistics by years