Download This statistics in other country:
Timeline:
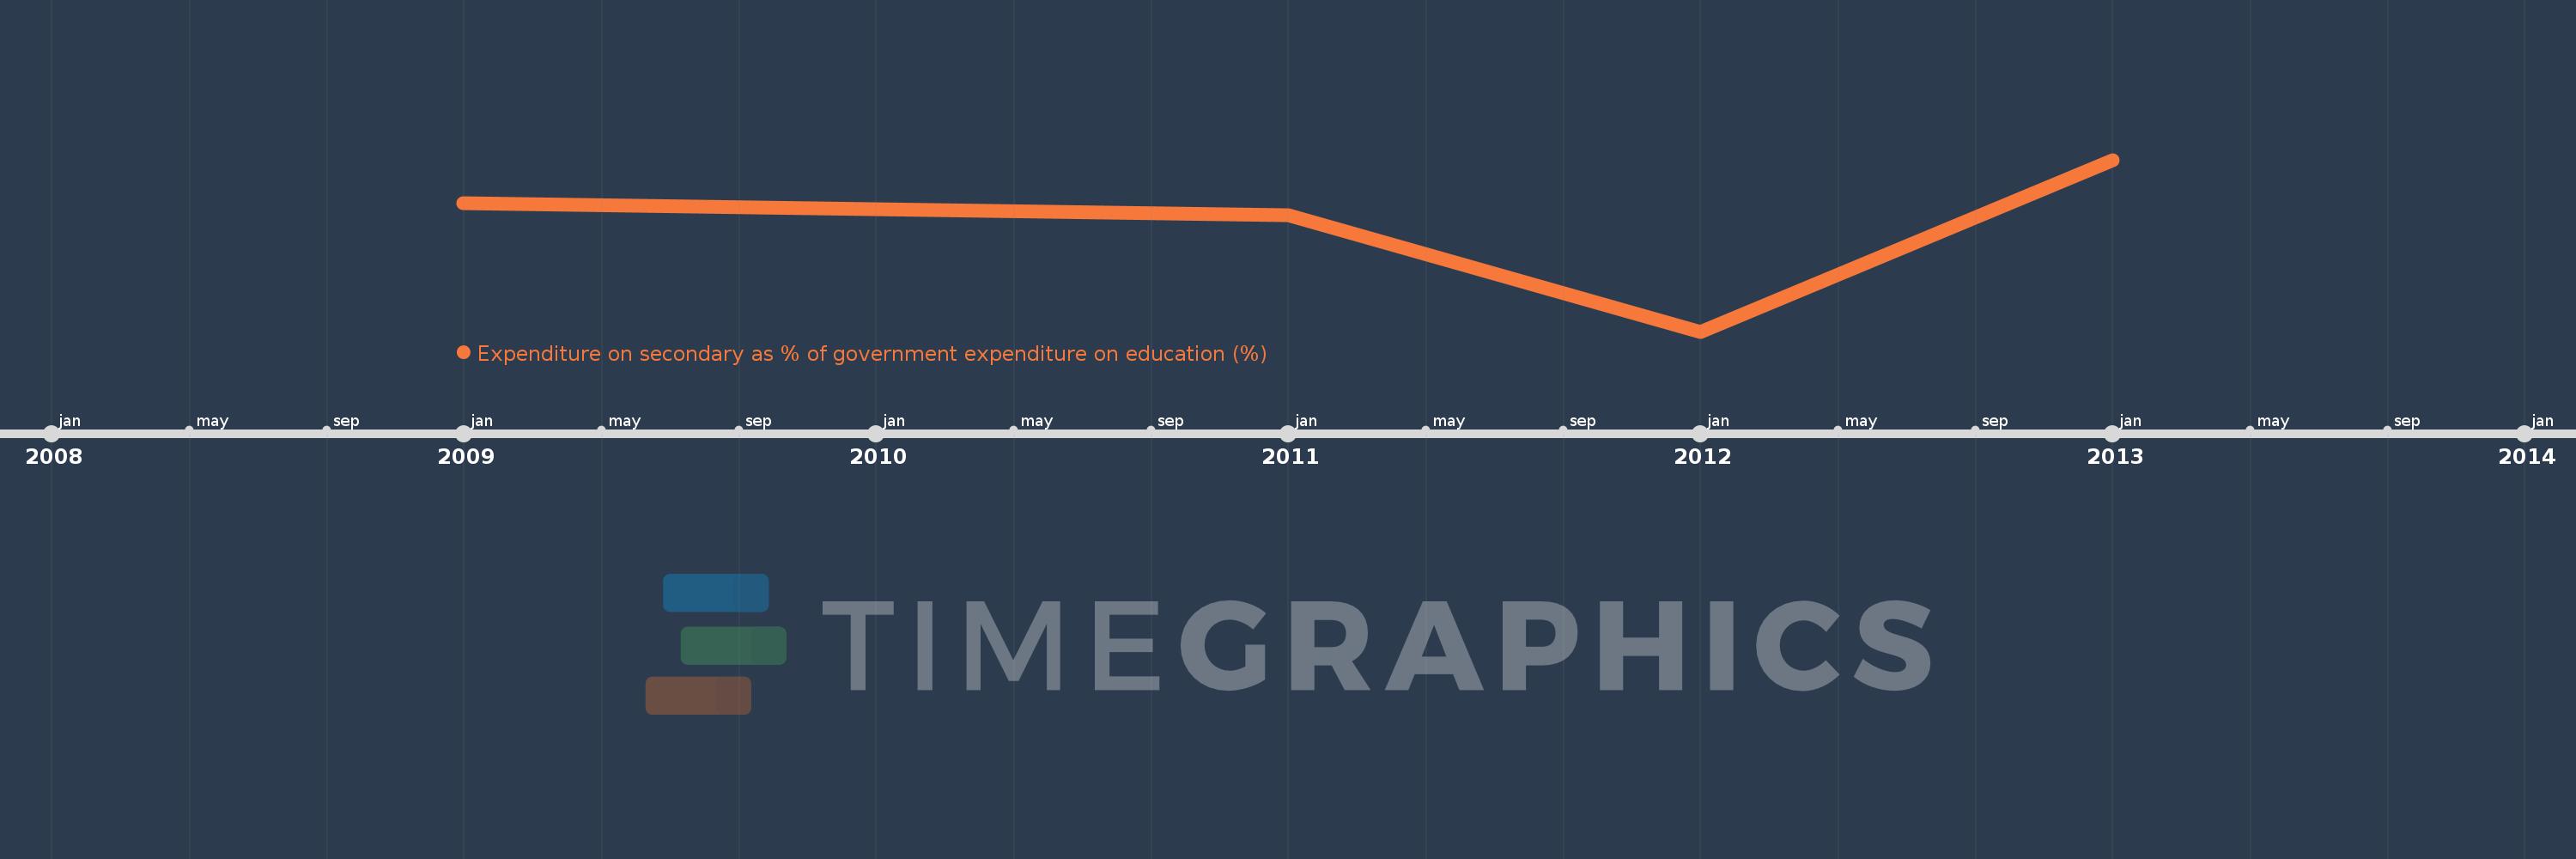
This timeline shows a graph from 2009 to 2013 of East Asia & Pacific. No data until 2008. Number of actual observations by date: 4.
Source name:
World Development Indicators
Source organization:
UNESCO Institute for Statistics
Categories, topics:
Education
Last updated:
apr 23, 2017
Indicators value changes by year
Maximum:
35.262
jan 1, 2013
At the date of observation
Value
Absolute change
Change from the previous value
jan 1, 2009
34.055
+34.055
0.0%
jan 1, 2011
33.717
-0.338
-0.99%
jan 1, 2012
30.47
-3.246
-9.63%
jan 1, 2013
35.262
+4.791
15.72%
Ranking of countries by current statistics by years