Download This statistics in other country:
Timeline:
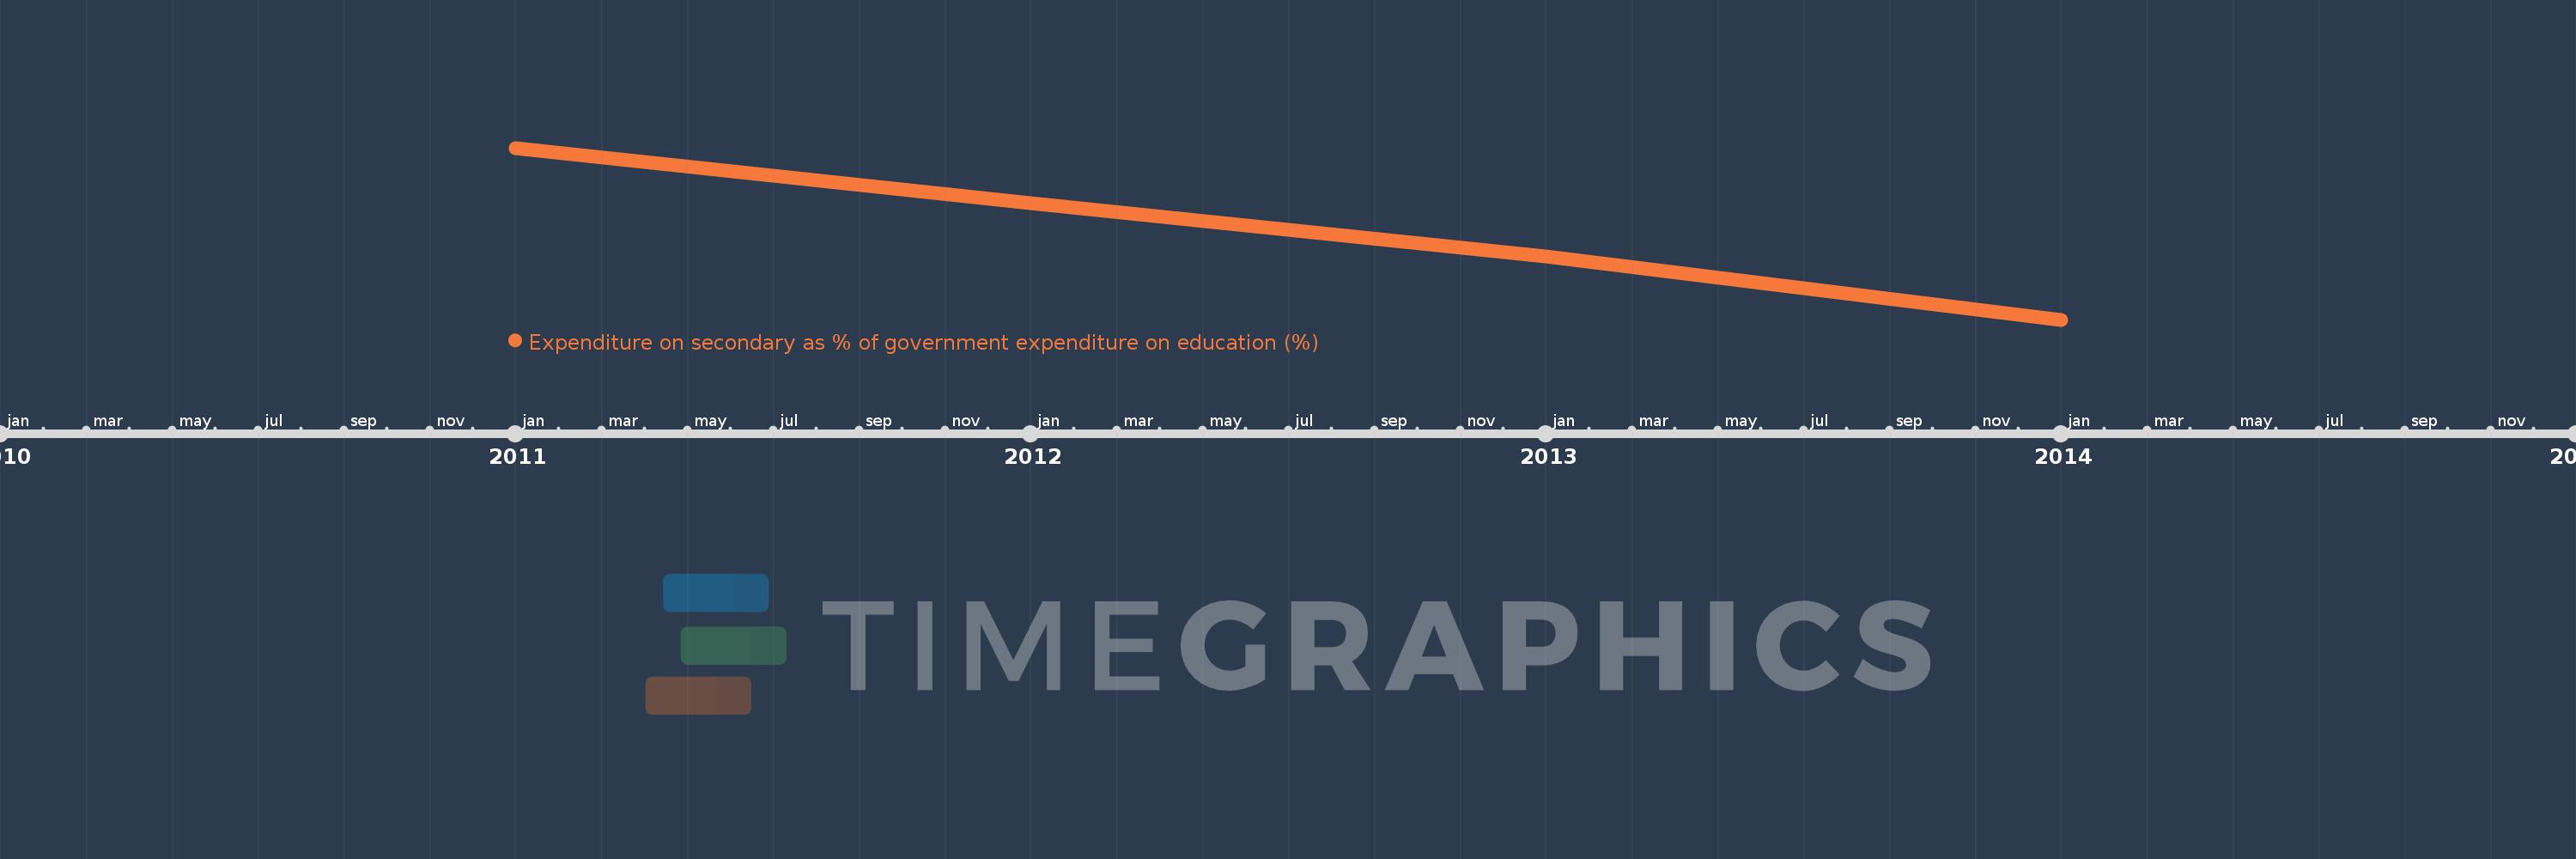
This timeline shows a graph from 2011 to 2014 of Guinea-Bissau. No data until 2010. Number of actual observations by date: 4.
Source name:
World Development Indicators
Source organization:
UNESCO Institute for Statistics
Categories, topics:
Education
Last updated:
apr 23, 2017
Indicators value changes by year
Minimum:
30.444
jan 1, 2014
Maximum:
46.666
jan 1, 2011
At the date of observation
Value
Absolute change
Change from the previous value
jan 1, 2011
46.666
+46.666
0.0%
jan 1, 2012
41.436
-5.231
-11.21%
jan 1, 2013
36.408
-5.027
-12.13%
jan 1, 2014
30.444
-5.964
-16.38%
Ranking of countries by current statistics by years