Download This statistics in other country:
Timeline:
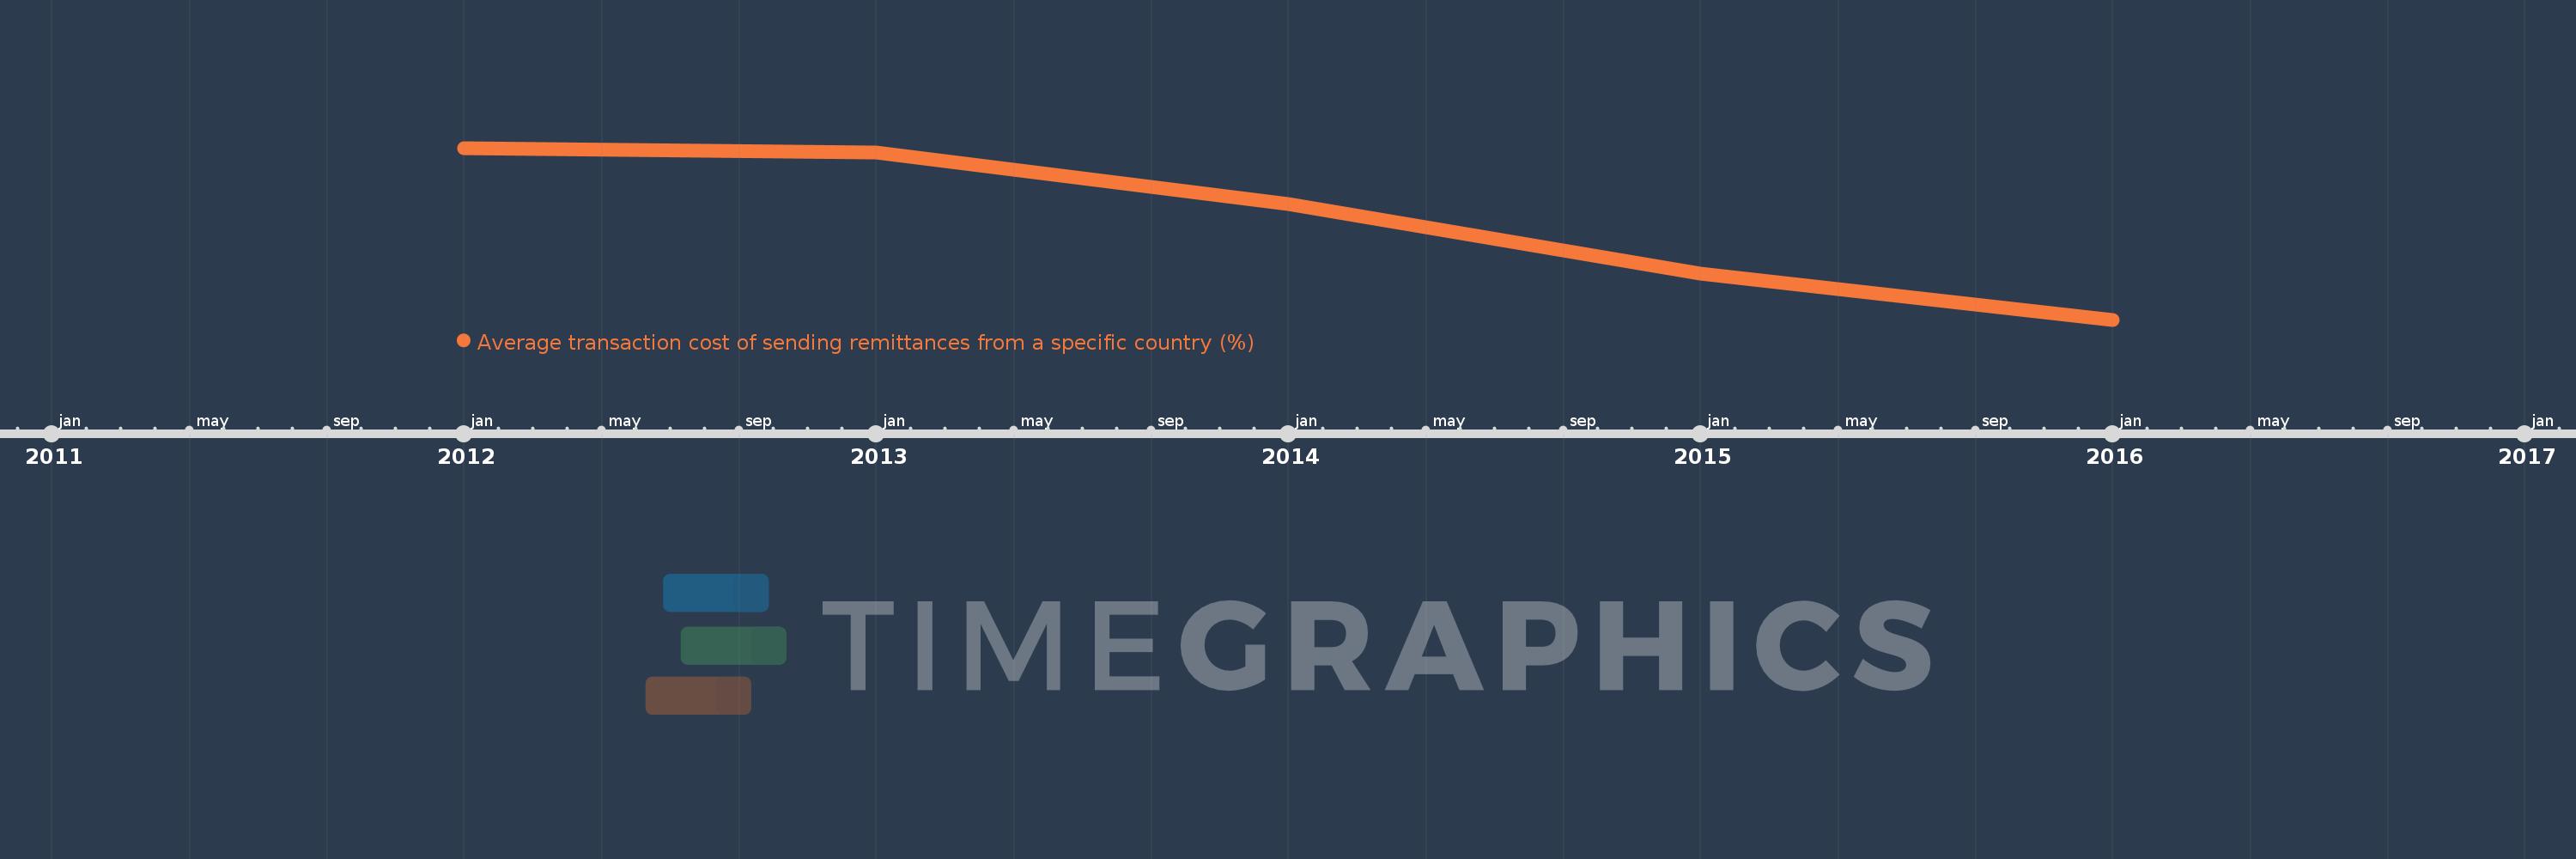
This timeline shows a graph from 2012 to 2016 of OECD members. No data until 2011. Number of actual observations by date: 5.
Source name:
World Development Indicators
Source organization:
World Bank, Remittance Prices Worldwide, available at http://remittanceprices.worldbank.org
Categories, topics:
Financial Sector
Last updated:
apr 23, 2017
Indicators value changes by year
At the date of observation
Value
Absolute change
Change from the previous value
jan 1, 2012
9.902
+9.902
0.0%
jan 1, 2013
9.853
-0.049
-0.5%
jan 1, 2014
9.34
-0.513
-5.21%
jan 1, 2015
8.647
-0.692
-7.41%
jan 1, 2016
8.192
-0.455
-5.26%
Ranking of countries by current statistics by years