Download This statistics in other country:
Timeline:
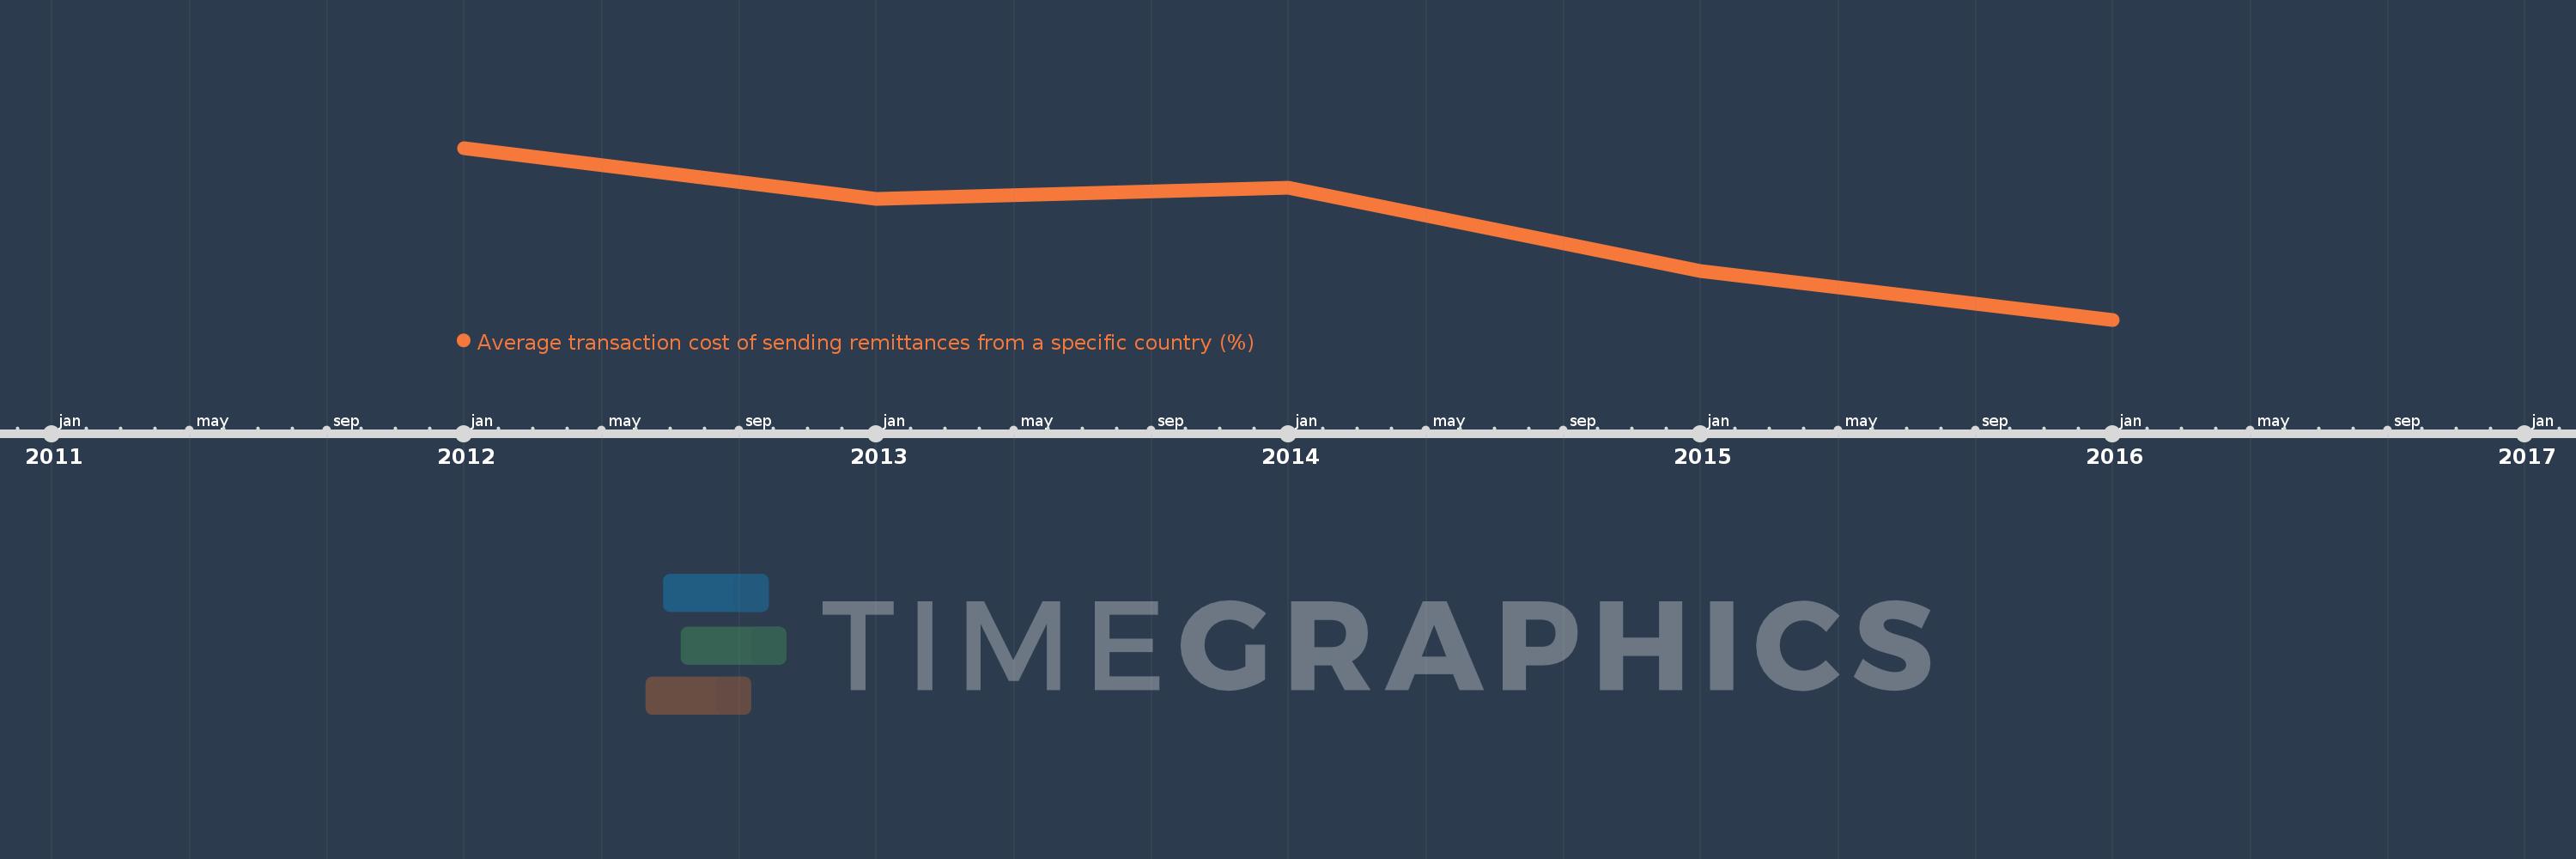
This timeline shows a graph from 2012 to 2016 of Japan. No data until 2011. Number of actual observations by date: 5.
Source name:
World Development Indicators
Source organization:
World Bank, Remittance Prices Worldwide, available at http://remittanceprices.worldbank.org
Categories, topics:
Financial Sector
Last updated:
apr 23, 2017
Indicators value changes by year
Maximum:
17.191
jan 1, 2012
At the date of observation
Value
Absolute change
Change from the previous value
jan 1, 2012
17.191
+17.191
0.0%
jan 1, 2013
16.01
-1.18
-6.87%
jan 1, 2014
16.277
+0.266
1.66%
jan 1, 2015
14.34
-1.937
-11.9%
jan 1, 2016
13.22
-1.119
-7.81%
Ranking of countries by current statistics by years