Download This statistics in other country:
Timeline:
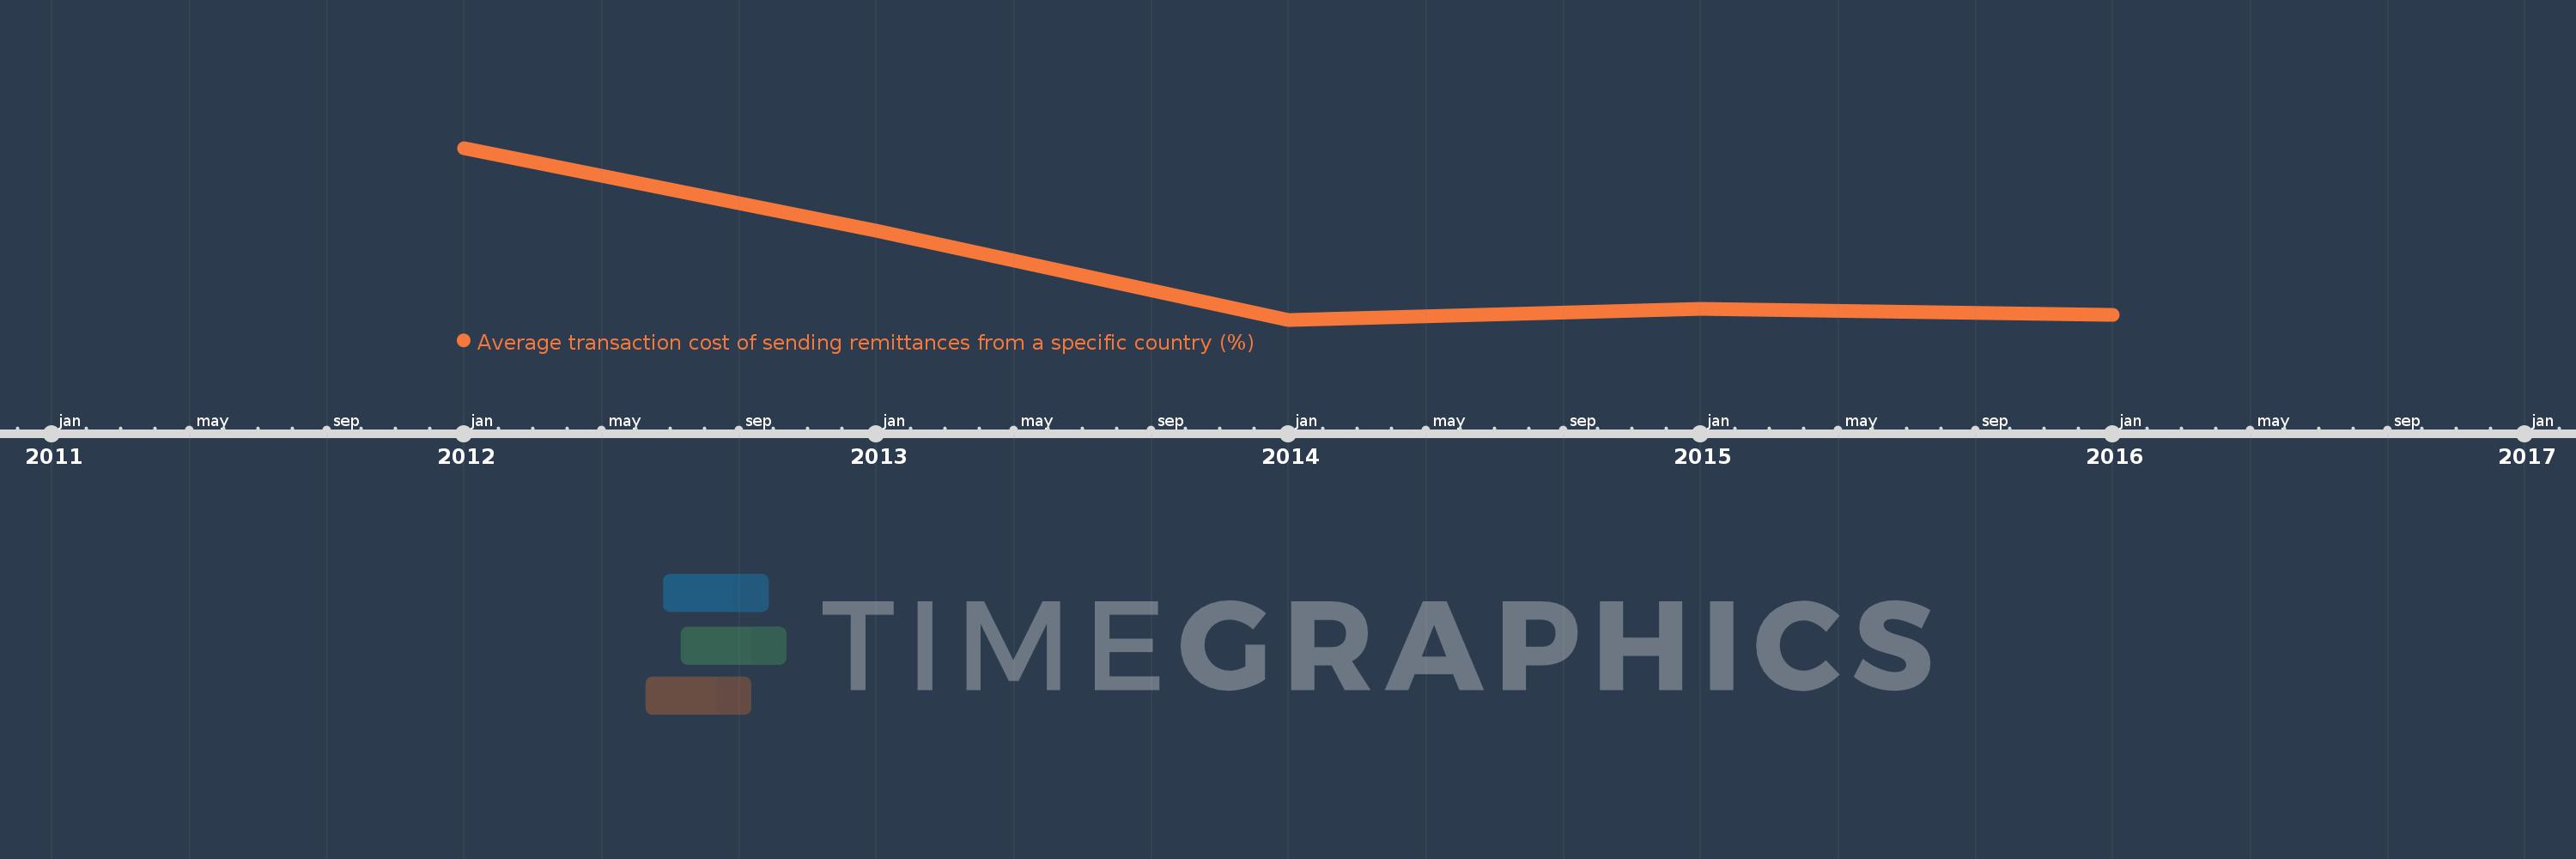
This timeline shows a graph from 2012 to 2016 of New Zealand. No data until 2011. Number of actual observations by date: 5.
Source name:
World Development Indicators
Source organization:
World Bank, Remittance Prices Worldwide, available at http://remittanceprices.worldbank.org
Categories, topics:
Financial Sector
Last updated:
apr 23, 2017
Indicators value changes by year
Maximum:
11.515
jan 1, 2012
At the date of observation
Value
Absolute change
Change from the previous value
jan 1, 2012
11.515
+11.515
0.0%
jan 1, 2013
10.333
-1.181
-10.26%
jan 1, 2014
9.055
-1.278
-12.37%
jan 1, 2015
9.214
+0.158
1.75%
jan 1, 2016
9.123
-0.09
-0.98%
Ranking of countries by current statistics by years