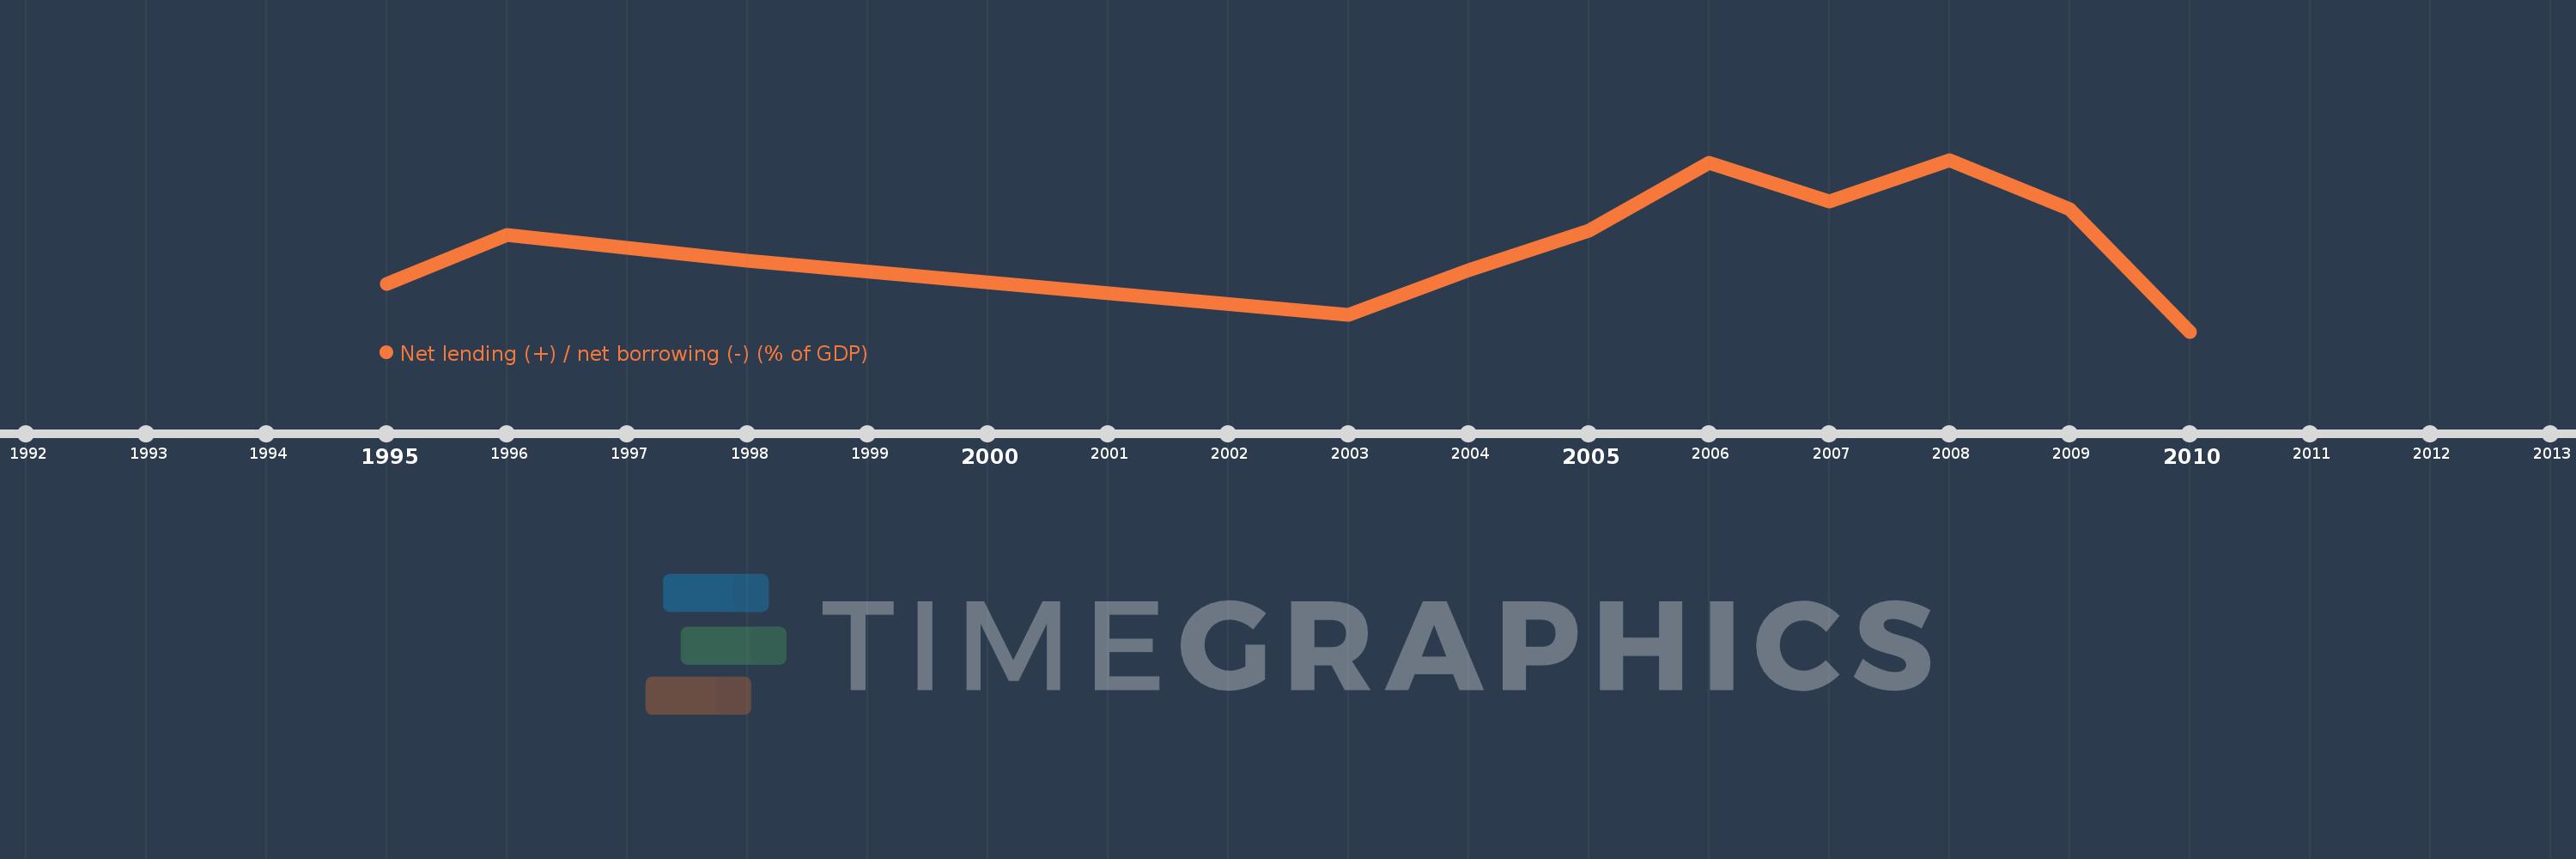
This timeline shows a graph from 1995 to 2010 of Middle East & North Africa (IDA & IBRD countries). No data until 1994. Number of actual observations by date: 11.
Source name:
World Development Indicators
Source organization:
International Monetary Fund, Government Finance Statistics Yearbook and data files.
Categories, topics:
Public Sector
Last updated:
apr 23, 2017
Indicators value changes by year
Meaning:
0.301
Minimum:
-2.141
jan 1, 2010
Maximum:
2.537
jan 1, 2008
At the date of observation
Value
Absolute change
Change from the previous value
jan 1, 1995
-0.852
-0.852
0.0%
jan 1, 1996
0.495
+1.347
-158.03%
jan 1, 1998
-0.201
-0.695
-140.6%
jan 1, 2003
-1.692
-1.491
742.68%
jan 1, 2004
-0.471
+1.221
-72.15%
jan 1, 2005
0.599
+1.07
-227.14%
jan 1, 2006
2.446
+1.847
308.22%
jan 1, 2007
1.391
-1.055
-43.13%
jan 1, 2008
2.537
+1.146
82.39%
jan 1, 2009
1.198
-1.338
-52.76%
jan 1, 2010
-2.141
-3.339
-278.64%
Ranking of countries by current statistics by years