33
/
AIzaSyB4mHJ5NPEv-XzF7P6NDYXjlkCWaeKw5bc
November 30, 2025
43716
Latin America & the Caribbean (IDA & IBRD countries)
TLA
false
2
1
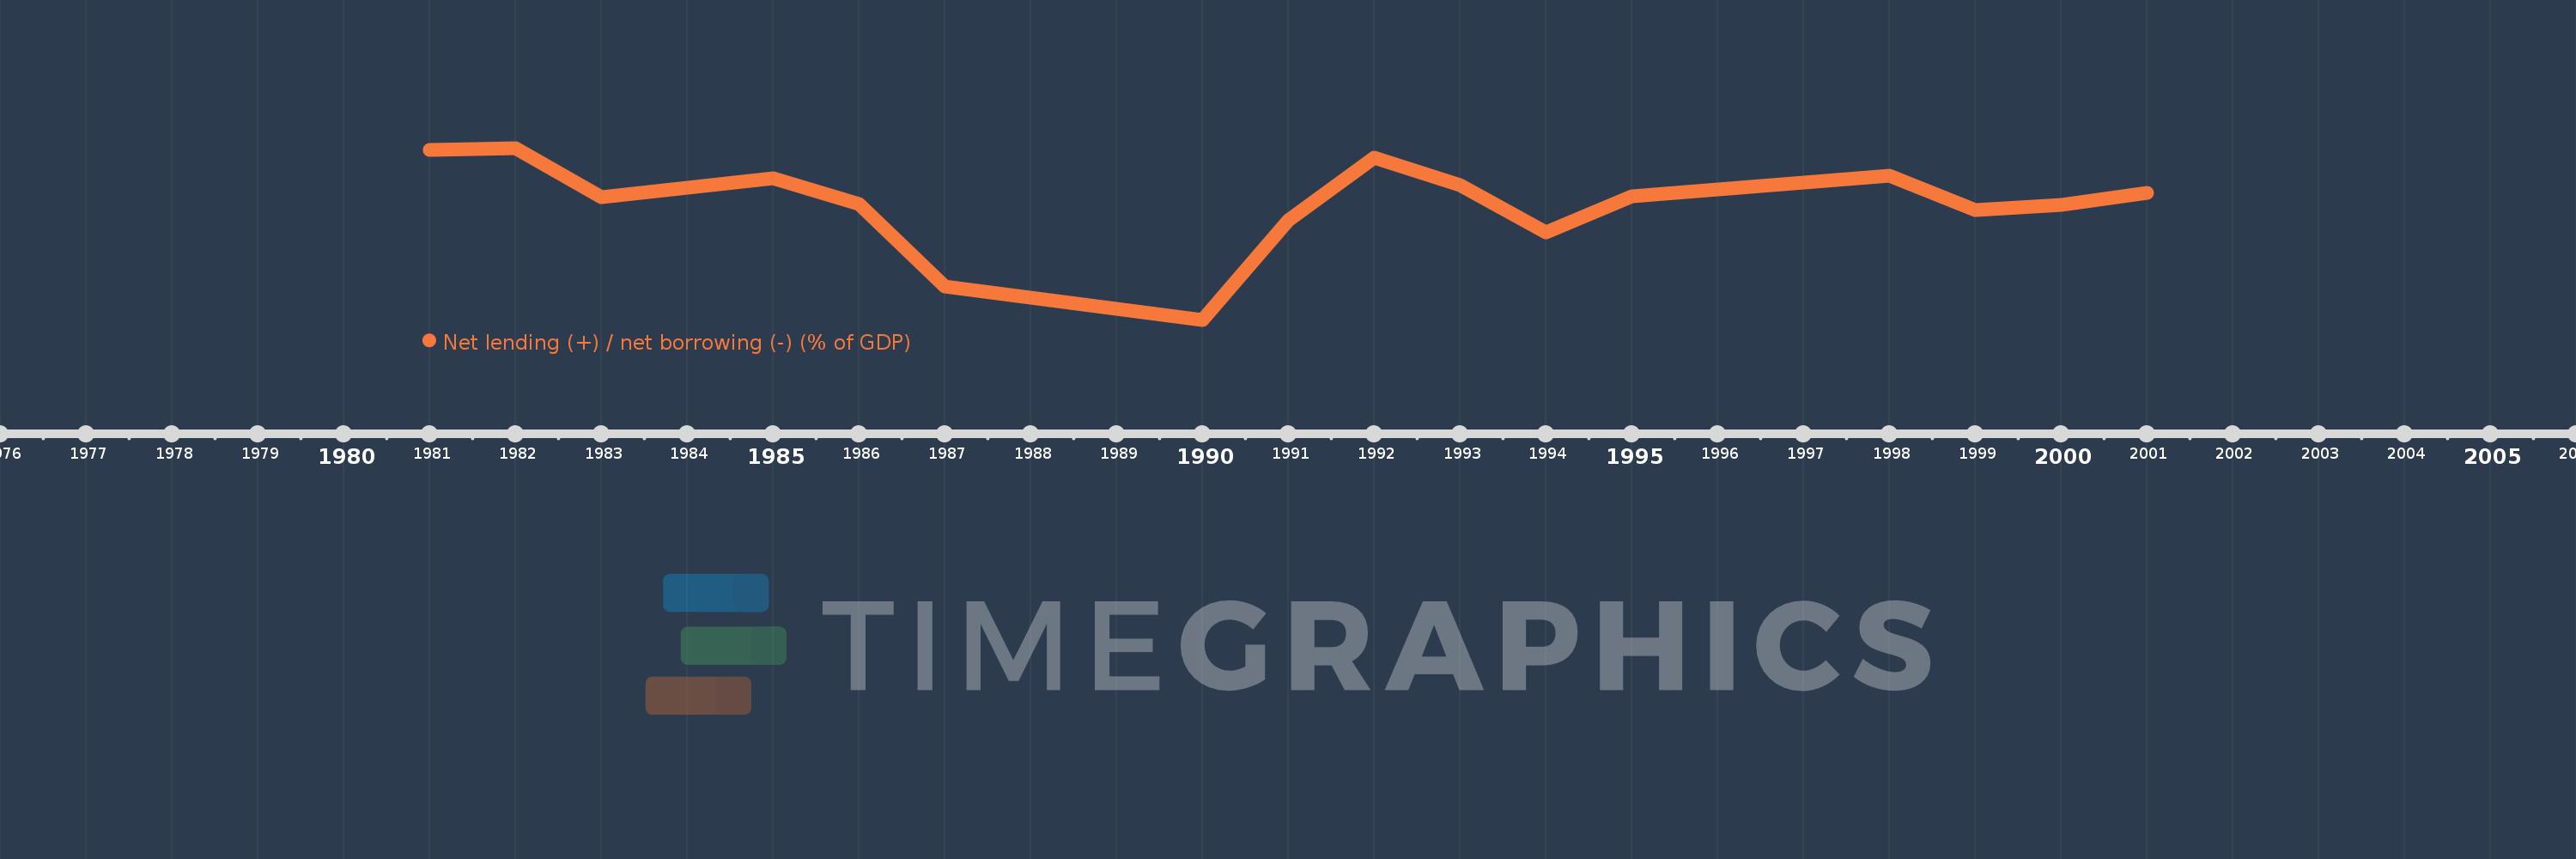
Net lending (+) / net borrowing (-) (% of GDP)
2001,2000,1999,1998,1995,1994,1993,1992,1991,1990,1987,1986,1985,1983,1982,1981