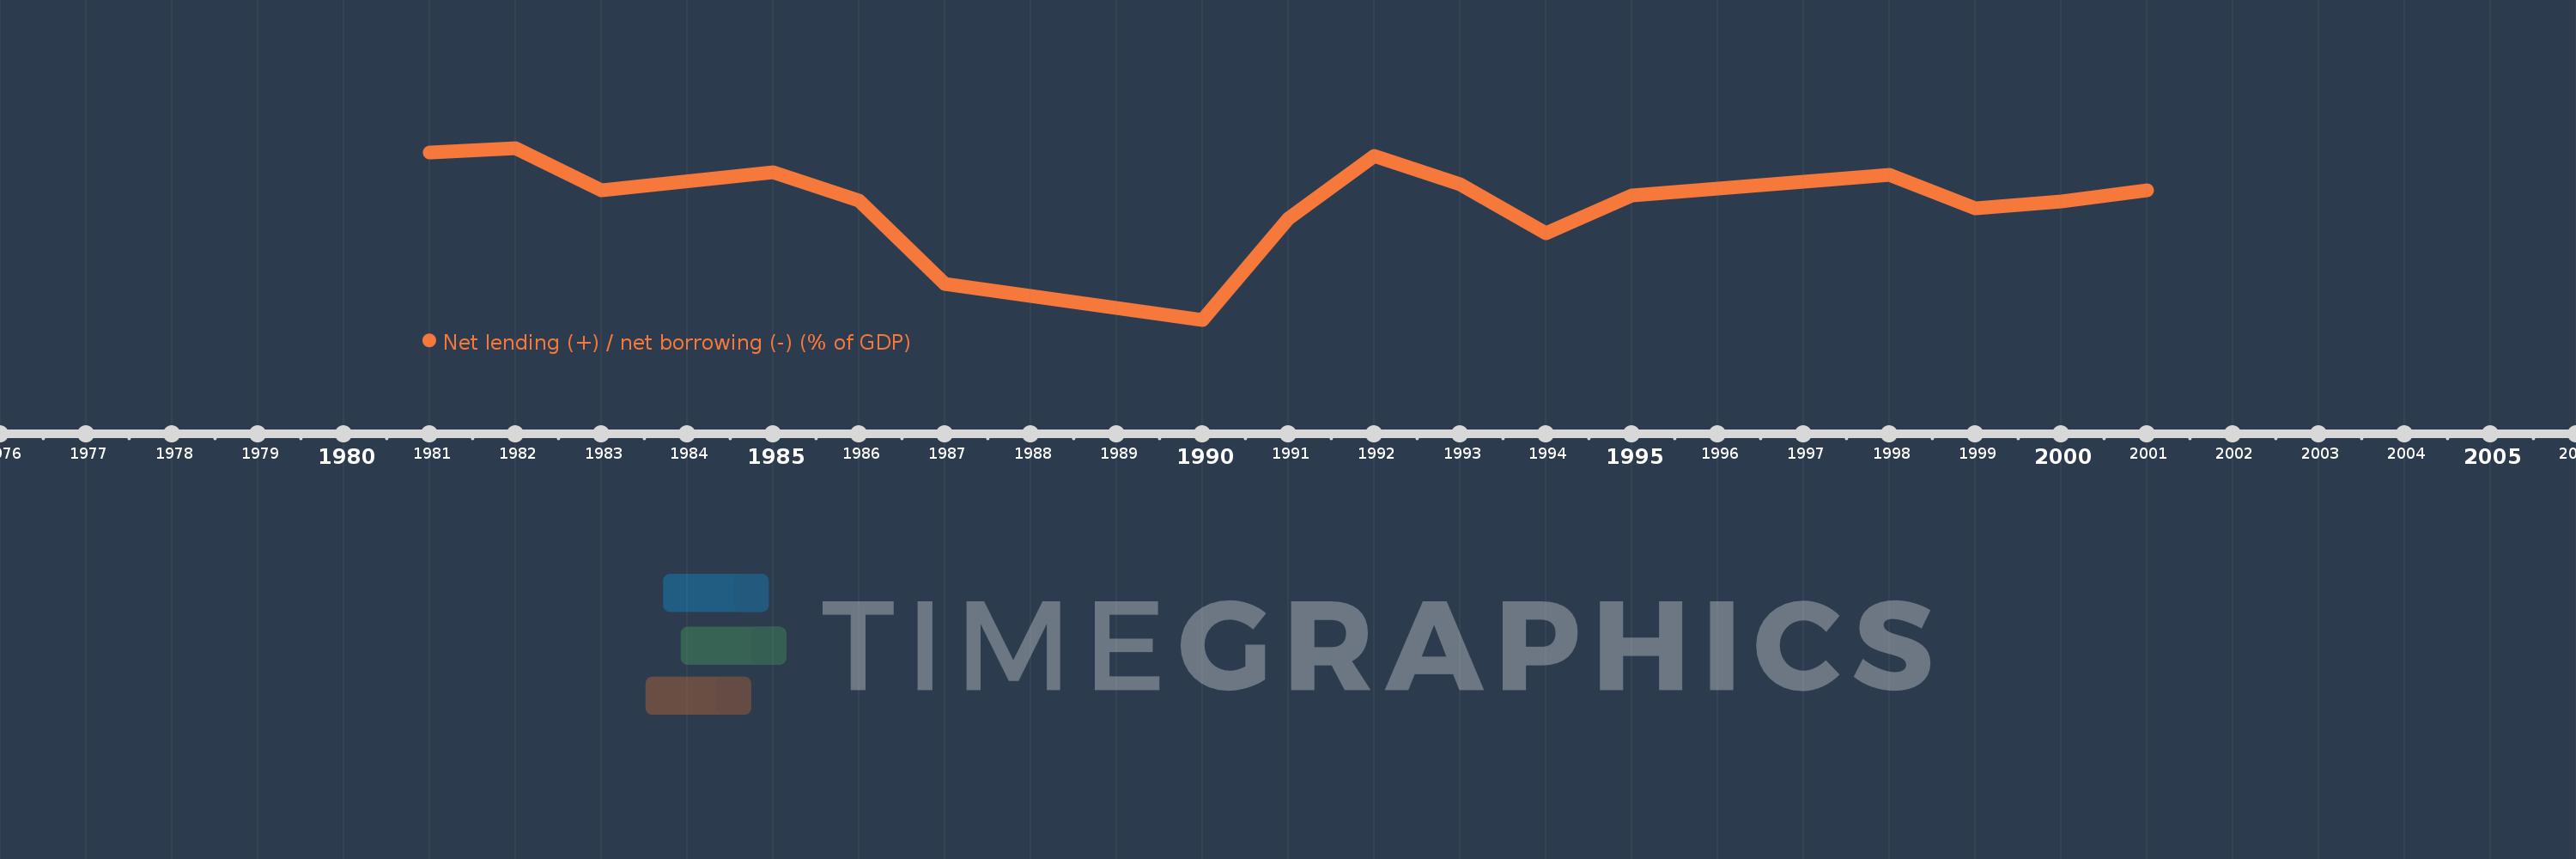
This timeline shows a graph from 1981 to 2001 of Latin America & Caribbean (excluding high income). No data until 1980. Number of actual observations by date: 16.
Source name:
World Development Indicators
Source organization:
International Monetary Fund, Government Finance Statistics Yearbook and data files.
Categories, topics:
Public Sector
Last updated:
apr 23, 2017
Indicators value changes by year
Meaning:
-2.176
Minimum:
-9.867
jan 1, 1990
Maximum:
1.341
jan 1, 1982
At the date of observation
Value
Absolute change
Change from the previous value
jan 1, 1981
1.019
+1.019
0.0%
jan 1, 1982
1.341
+0.322
31.55%
jan 1, 1983
-1.429
-2.77
-206.54%
jan 1, 1985
-0.22
+1.209
-84.6%
jan 1, 1986
-2.074
-1.854
842.3%
jan 1, 1987
-7.557
-5.483
264.4%
jan 1, 1990
-9.867
-2.31
30.57%
jan 1, 1991
-3.279
+6.588
-66.77%
jan 1, 1992
0.822
+4.101
-125.07%
jan 1, 1993
-1.054
-1.876
-228.18%
jan 1, 1994
-4.201
-3.147
298.68%
jan 1, 1995
-1.753
+2.448
-58.26%
jan 1, 1998
-0.427
+1.326
-75.62%
jan 1, 1999
-2.598
-2.171
507.9%
jan 1, 2000
-2.138
+0.46
-17.7%
jan 1, 2001
-1.395
+0.744
-34.78%
Ranking of countries by current statistics by years