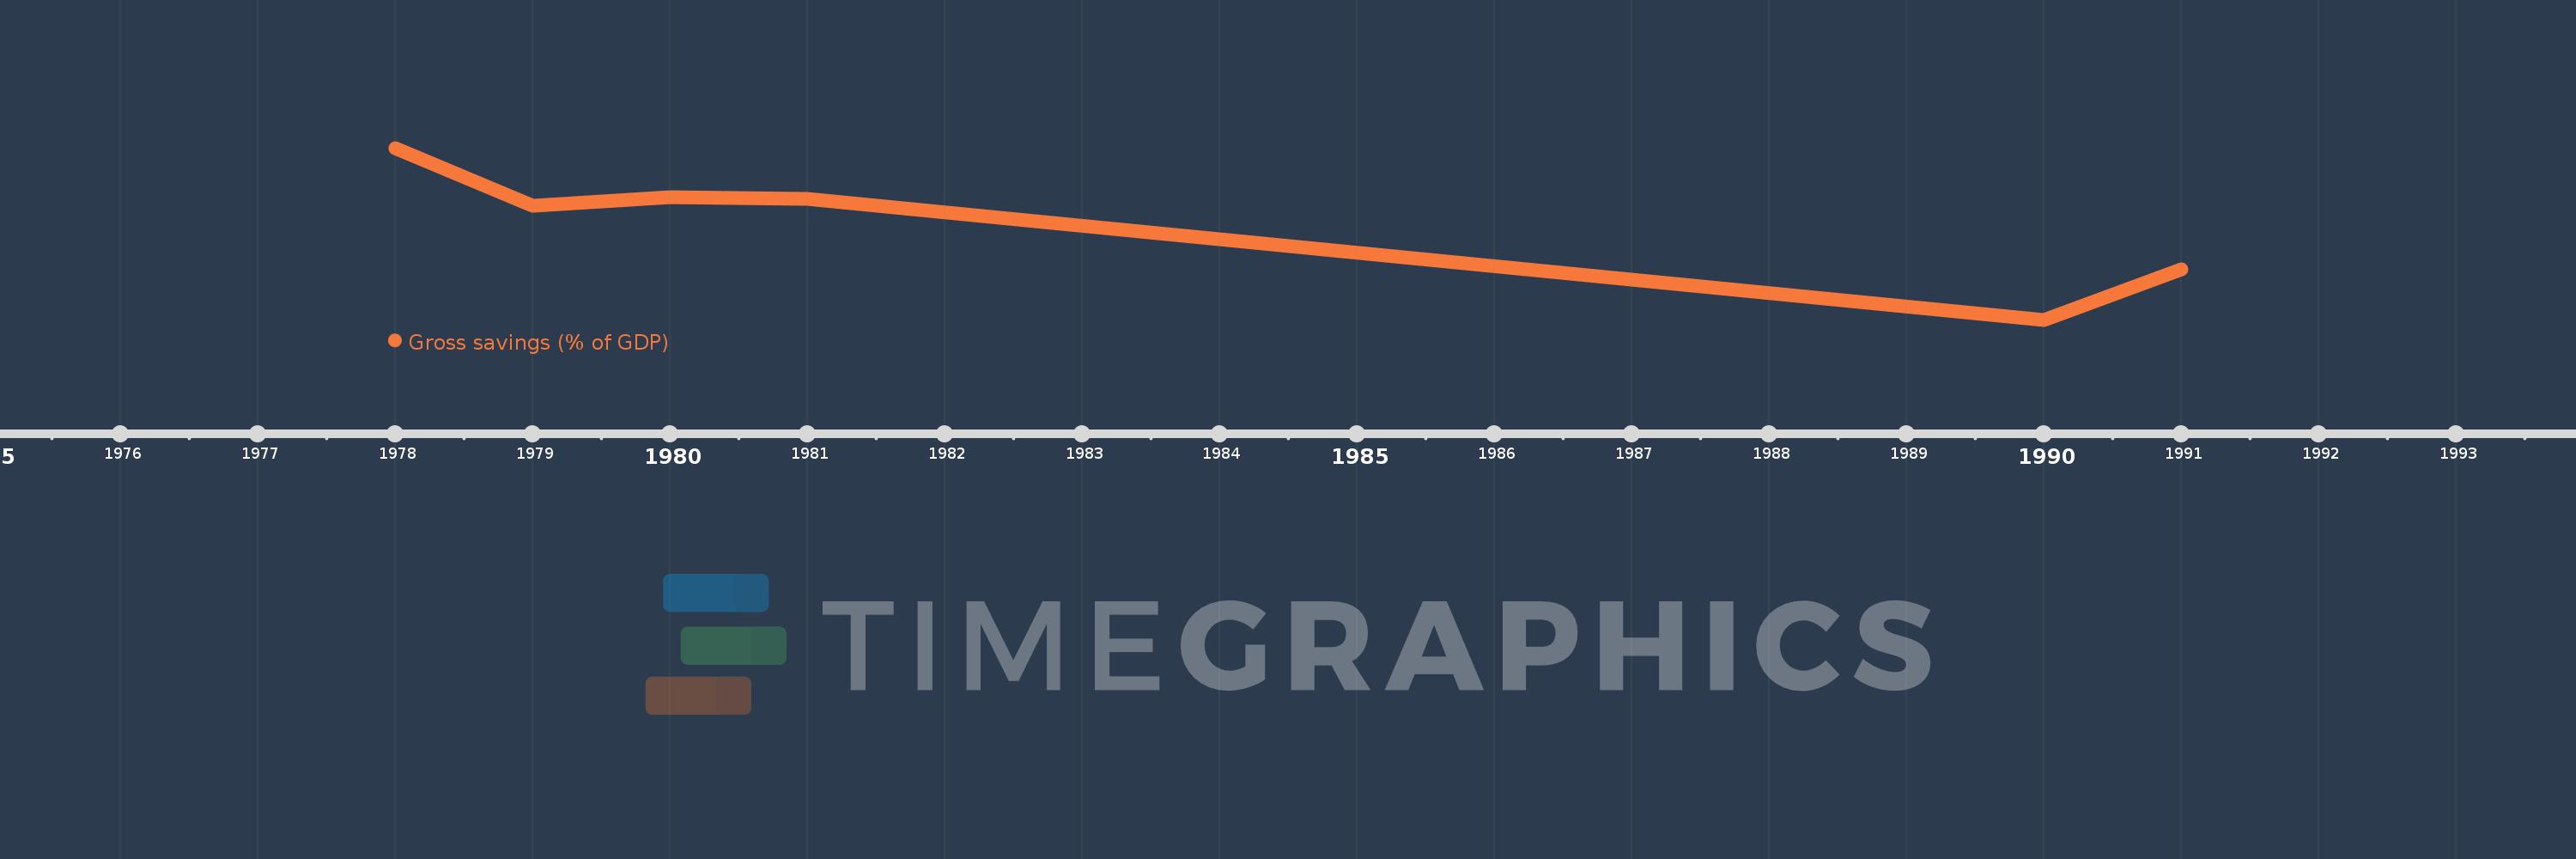
This timeline shows a graph from 1978 to 1991 of Middle East & North Africa (IDA & IBRD countries). No data until 1977. Number of actual observations by date: 6.
Source name:
World Development Indicators
Source organization:
World Bank national accounts data, and OECD National Accounts data files.
Categories, topics:
Economy & Growth
Last updated:
apr 23, 2017
Indicators value changes by year
Meaning:
30.029
Minimum:
21.007
jan 1, 1990
Maximum:
37.044
jan 1, 1978
At the date of observation
Value
Absolute change
Change from the previous value
jan 1, 1978
37.044
+37.044
0.0%
jan 1, 1979
31.653
-5.391
-14.55%
jan 1, 1980
32.432
+0.779
2.46%
jan 1, 1981
32.288
-0.143
-0.44%
jan 1, 1990
21.007
-11.281
-34.94%
jan 1, 1991
25.751
+4.744
22.59%
Ranking of countries by current statistics by years