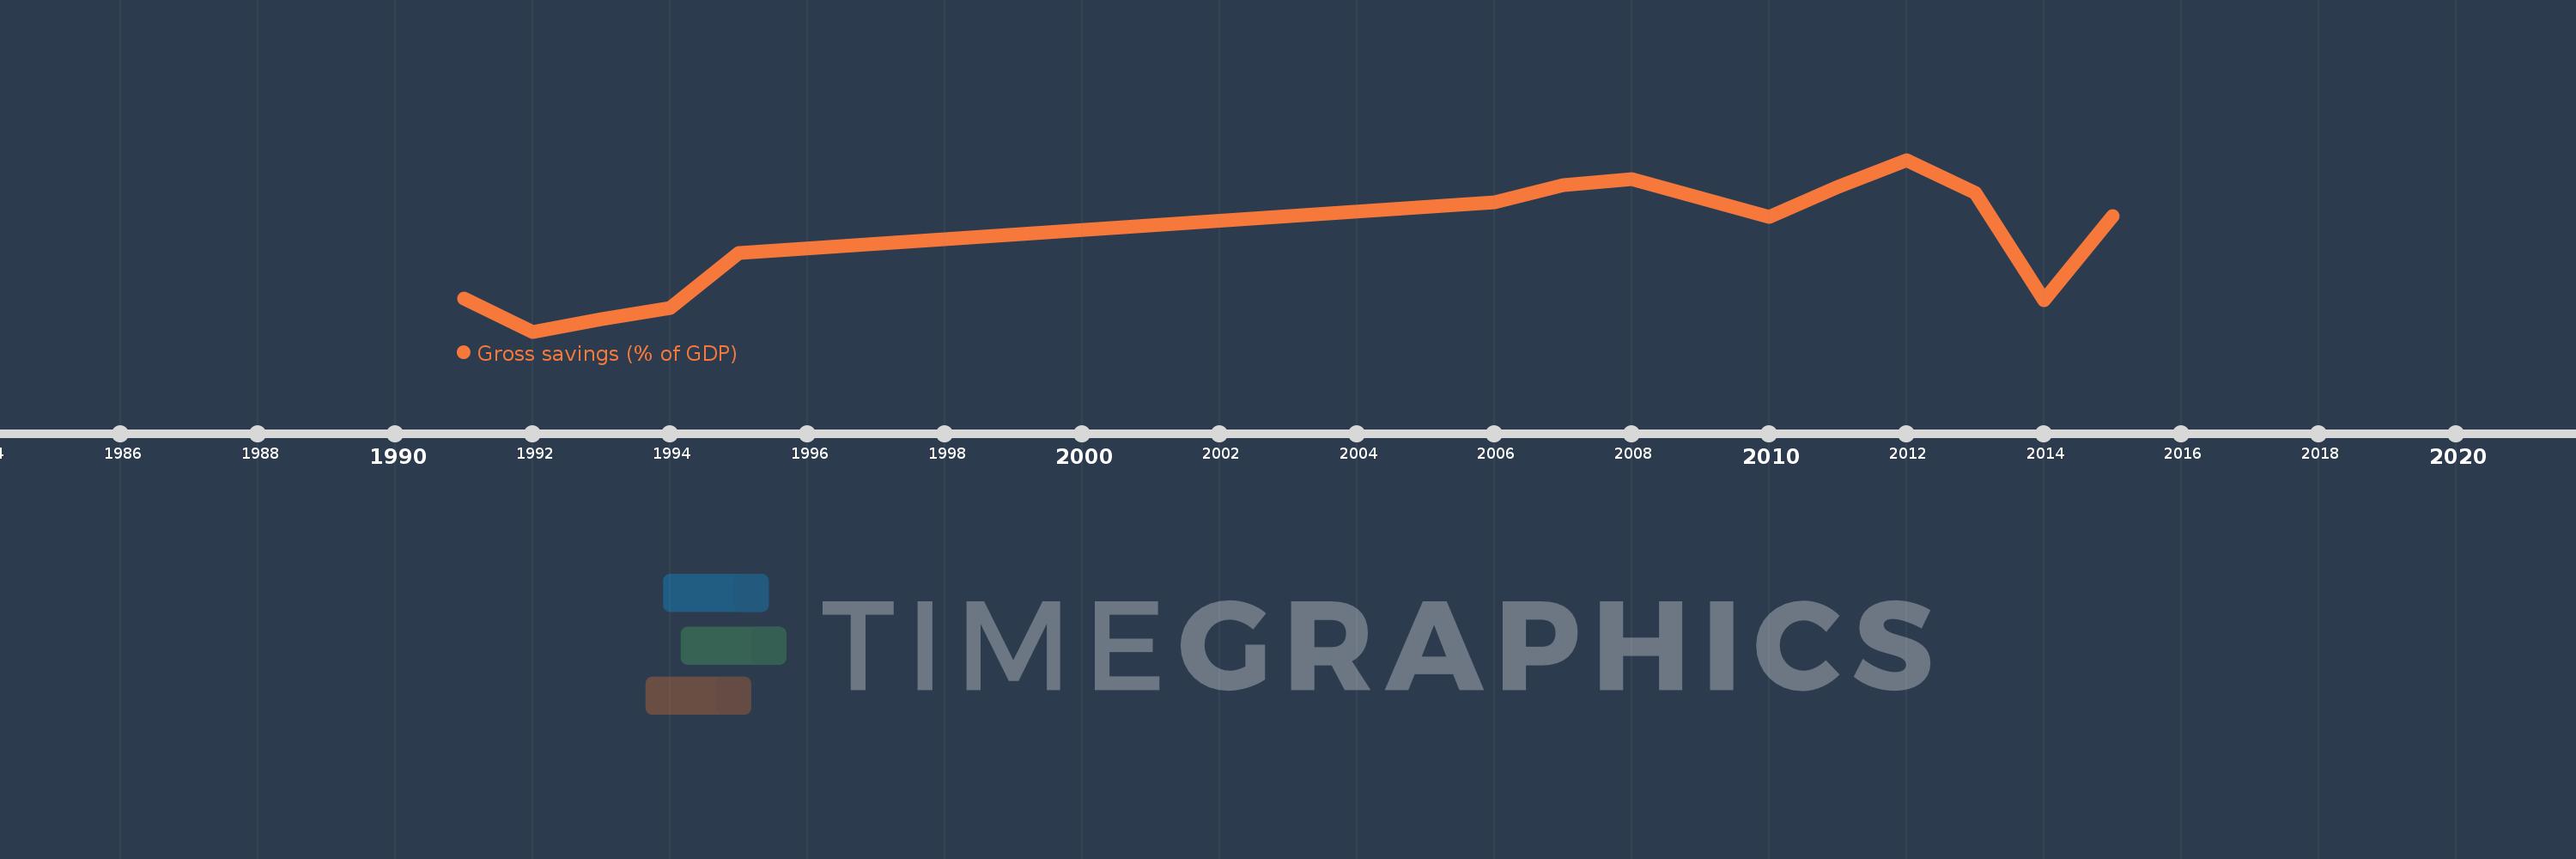
This timeline shows a graph from 1991 to 2015 of Heavily indebted poor countries (HIPC). No data until 1990. Number of actual observations by date: 15.
Source name:
World Development Indicators
Source organization:
World Bank national accounts data, and OECD National Accounts data files.
Categories, topics:
Economy & Growth
Last updated:
apr 23, 2017
Indicators value changes by year
Meaning:
13.299
Minimum:
7.539
jan 1, 1992
Maximum:
17.946
jan 1, 2012
At the date of observation
Value
Absolute change
Change from the previous value
jan 1, 1991
9.566
+9.566
0.0%
jan 1, 1992
7.539
-2.027
-21.19%
jan 1, 1993
8.269
+0.73
9.68%
jan 1, 1994
8.982
+0.713
8.62%
jan 1, 1995
12.277
+3.295
36.69%
jan 1, 2006
15.385
+3.108
25.31%
jan 1, 2007
16.388
+1.003
6.52%
jan 1, 2008
16.751
+0.363
2.22%
jan 1, 2009
15.612
-1.138
-6.8%
jan 1, 2010
14.473
-1.139
-7.3%
jan 1, 2011
16.328
+1.855
12.82%
jan 1, 2012
17.946
+1.618
9.91%
jan 1, 2013
15.951
-1.995
-11.12%
jan 1, 2014
9.46
-6.491
-40.69%
jan 1, 2015
14.562
+5.102
53.93%
Ranking of countries by current statistics by years