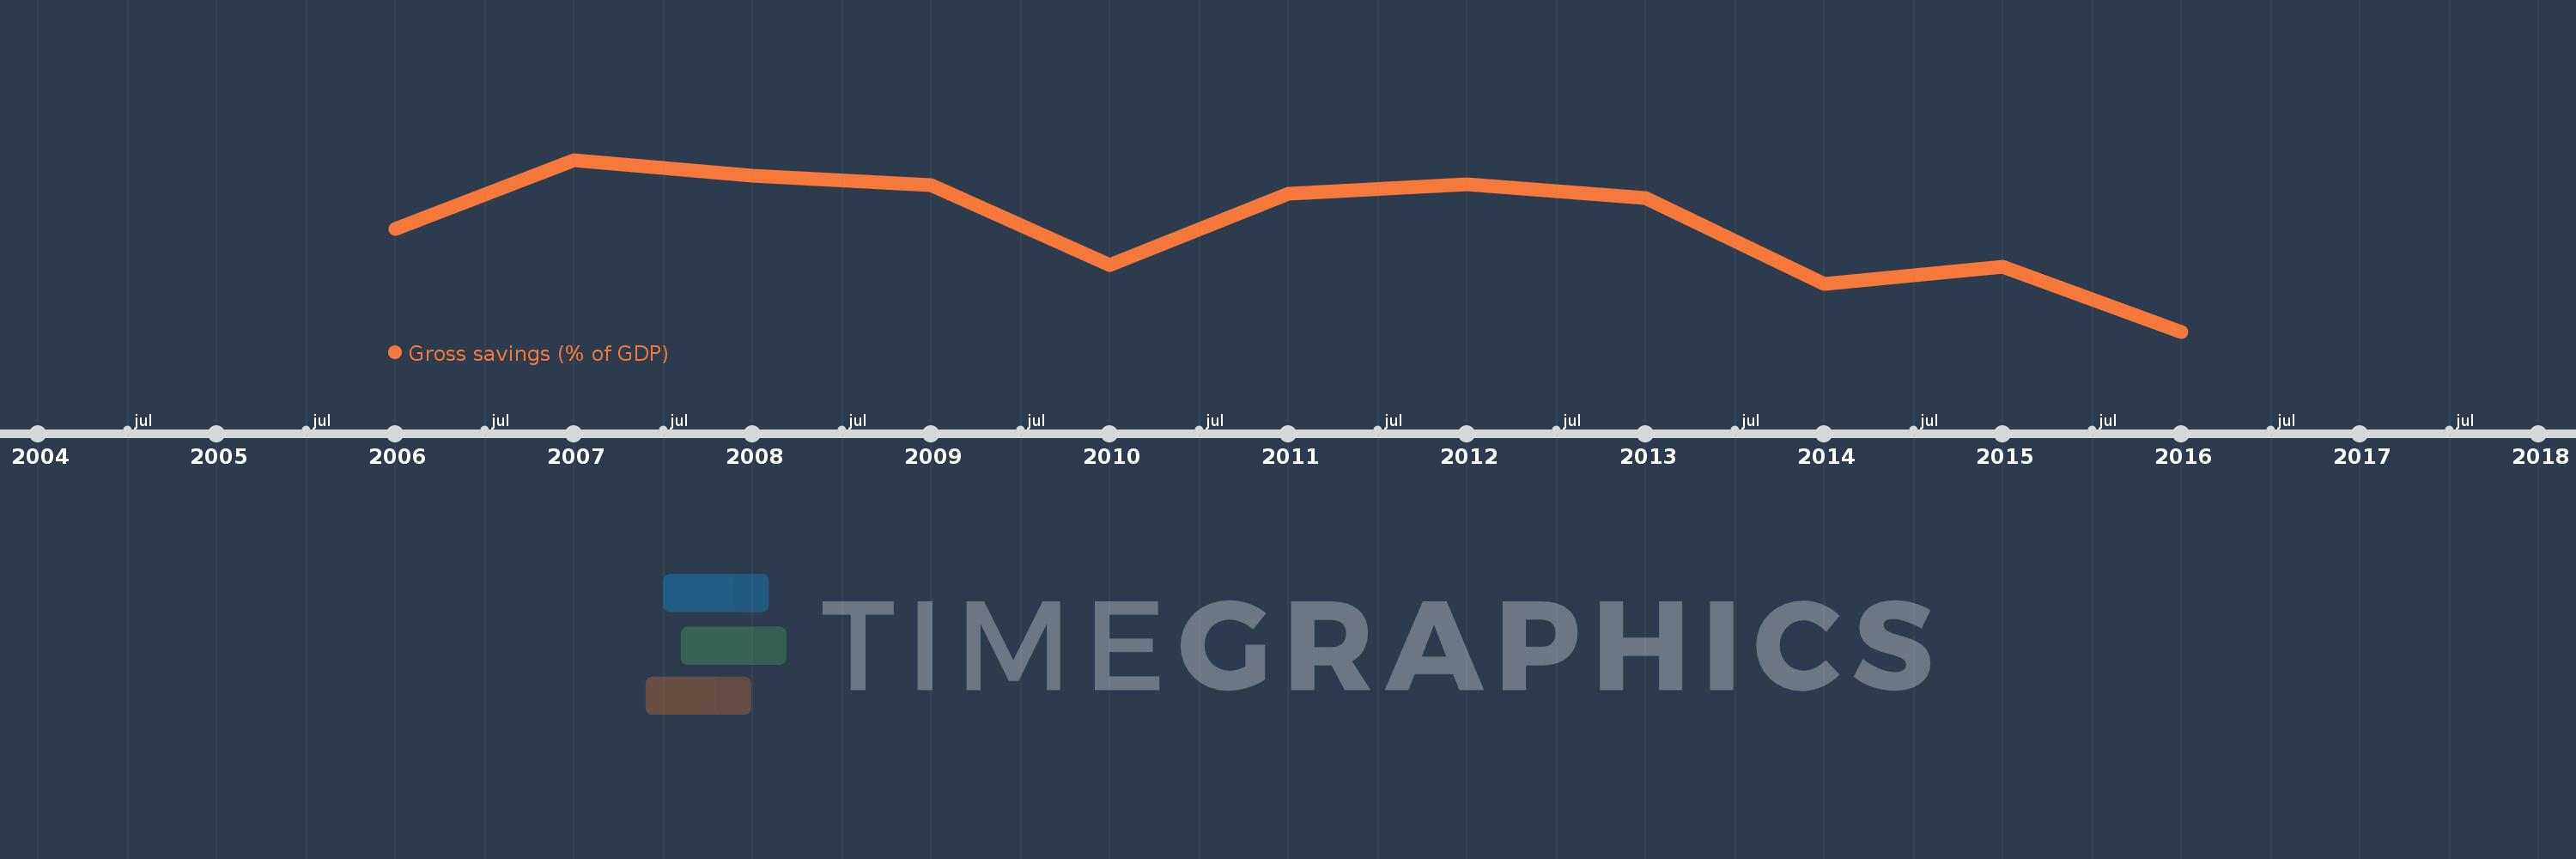
This timeline shows a graph from 2006 to 2016 of Least developed countries: UN classification. No data until 2005. Number of actual observations by date: 11.
Source name:
World Development Indicators
Source organization:
World Bank national accounts data, and OECD National Accounts data files.
Categories, topics:
Economy & Growth
Last updated:
apr 23, 2017
Indicators value changes by year
Meaning:
21.897
Minimum:
15.114
jan 1, 2016
Maximum:
26.011
jan 1, 2007
At the date of observation
Value
Absolute change
Change from the previous value
jan 1, 2006
21.622
+21.622
0.0%
jan 1, 2007
26.011
+4.389
20.3%
jan 1, 2008
25.028
-0.983
-3.78%
jan 1, 2009
24.426
-0.602
-2.41%
jan 1, 2010
19.345
-5.081
-20.8%
jan 1, 2011
23.861
+4.516
23.34%
jan 1, 2012
24.478
+0.617
2.58%
jan 1, 2013
23.611
-0.867
-3.54%
jan 1, 2014
18.123
-5.488
-23.24%
jan 1, 2015
19.245
+1.122
6.19%
jan 1, 2016
15.114
-4.131
-21.47%
Ranking of countries by current statistics by years