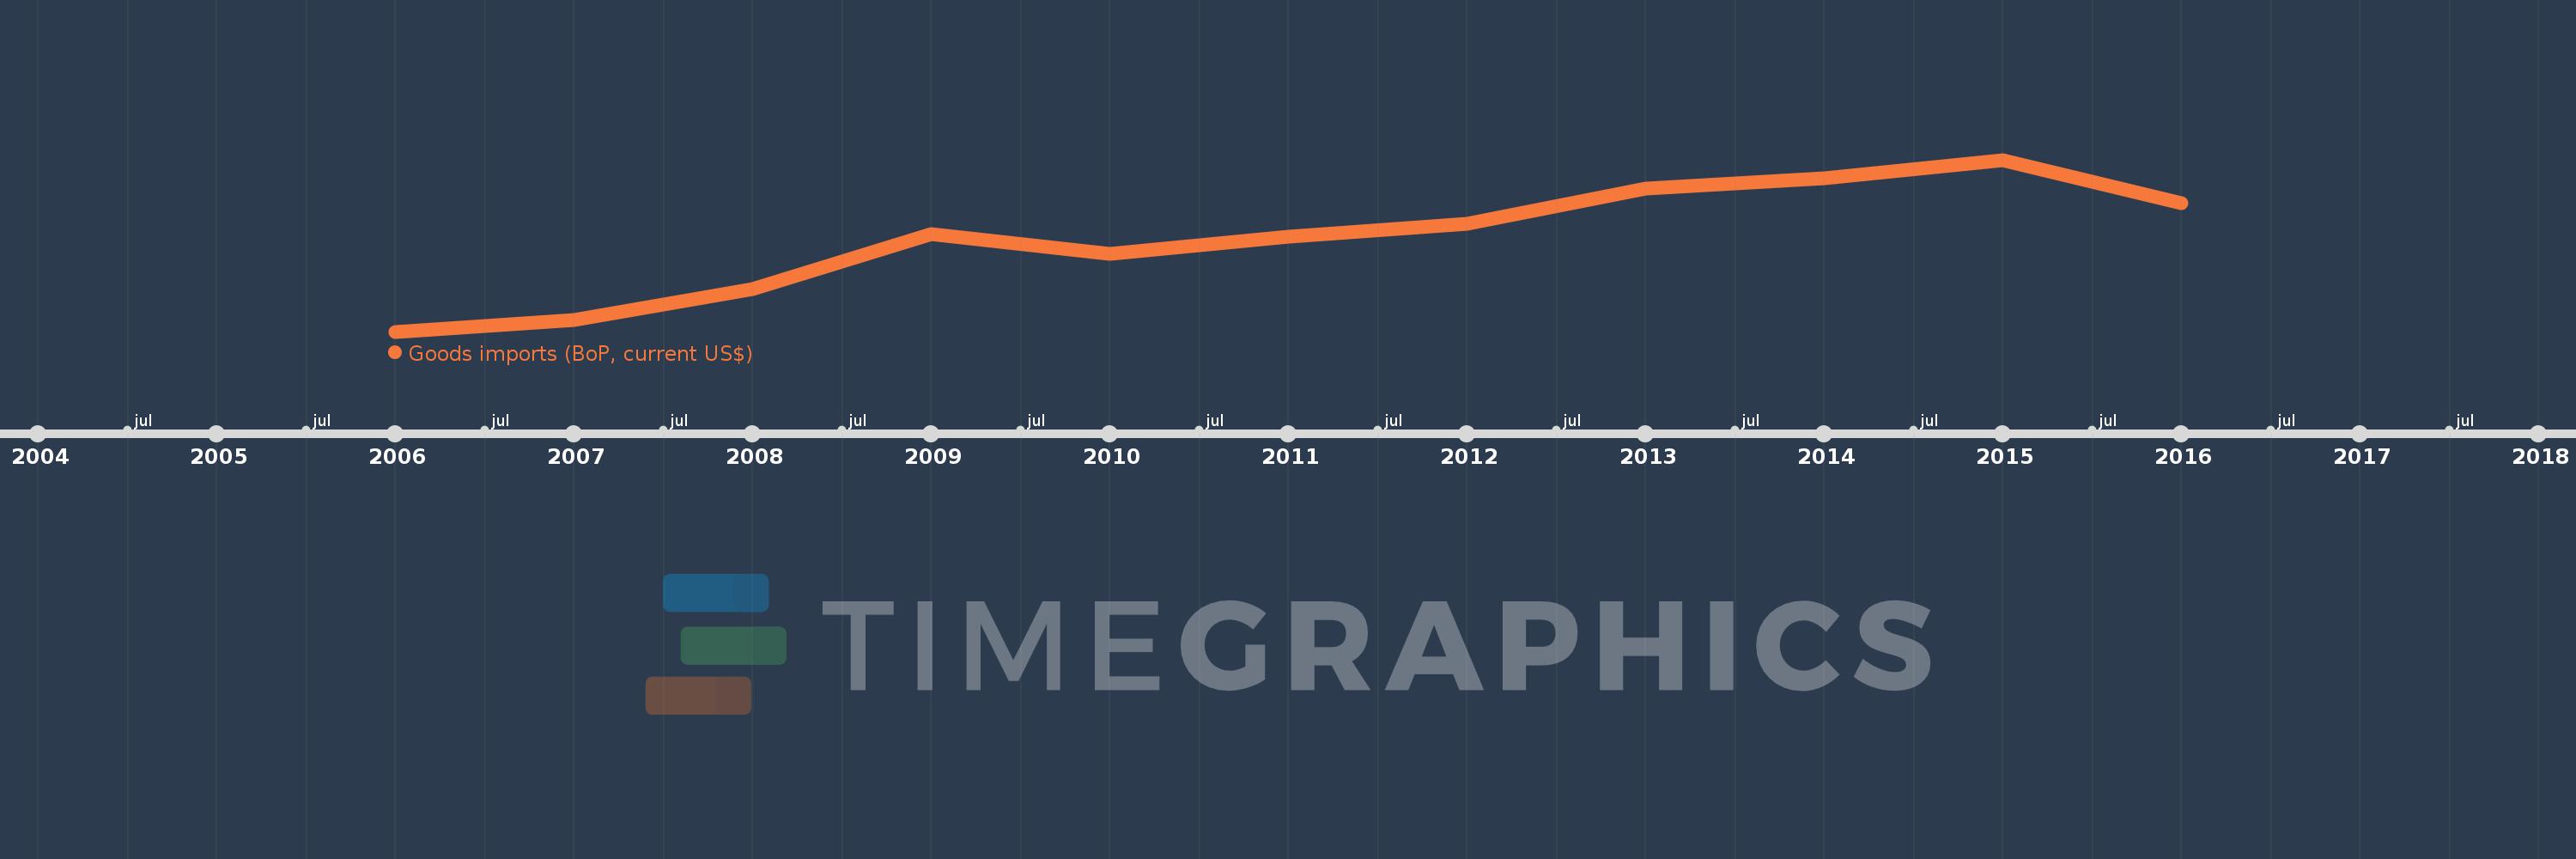
This timeline shows a graph from 2006 to 2016 of Middle East & North Africa (IDA & IBRD countries). No data until 2005. Number of actual observations by date: 11.
Source name:
World Development Indicators
Source organization:
International Monetary Fund, Balance of Payments Statistics Yearbook and data files.
Categories, topics:
Economy & Growth, Trade
Last updated:
apr 23, 2017
Indicators value changes by year
Meaning:
310.396 bln
Minimum:
168.627 bln
jan 1, 2006
Maximum:
429.377 bln
jan 1, 2015
At the date of observation
Value
Absolute change
Change from the previous value
jan 1, 2006
168.627 bln
+168.627 bln
0.0%
jan 1, 2007
185.734 bln
+17.107 bln
10.15%
jan 1, 2008
232.848 bln
+47.114 bln
25.37%
jan 1, 2009
316.533 bln
+83.685 bln
35.94%
jan 1, 2010
286.193 bln
-30.34 bln
-9.59%
jan 1, 2011
312.425 bln
+26.232 bln
9.17%
jan 1, 2012
331.961 bln
+19.536 bln
6.25%
jan 1, 2013
385.755 bln
+53.794 bln
16.2%
jan 1, 2014
401.345 bln
+15.59 bln
4.04%
jan 1, 2015
429.377 bln
+28.032 bln
6.98%
jan 1, 2016
363.563 bln
-65.814 bln
-15.33%
Ranking of countries by current statistics by years