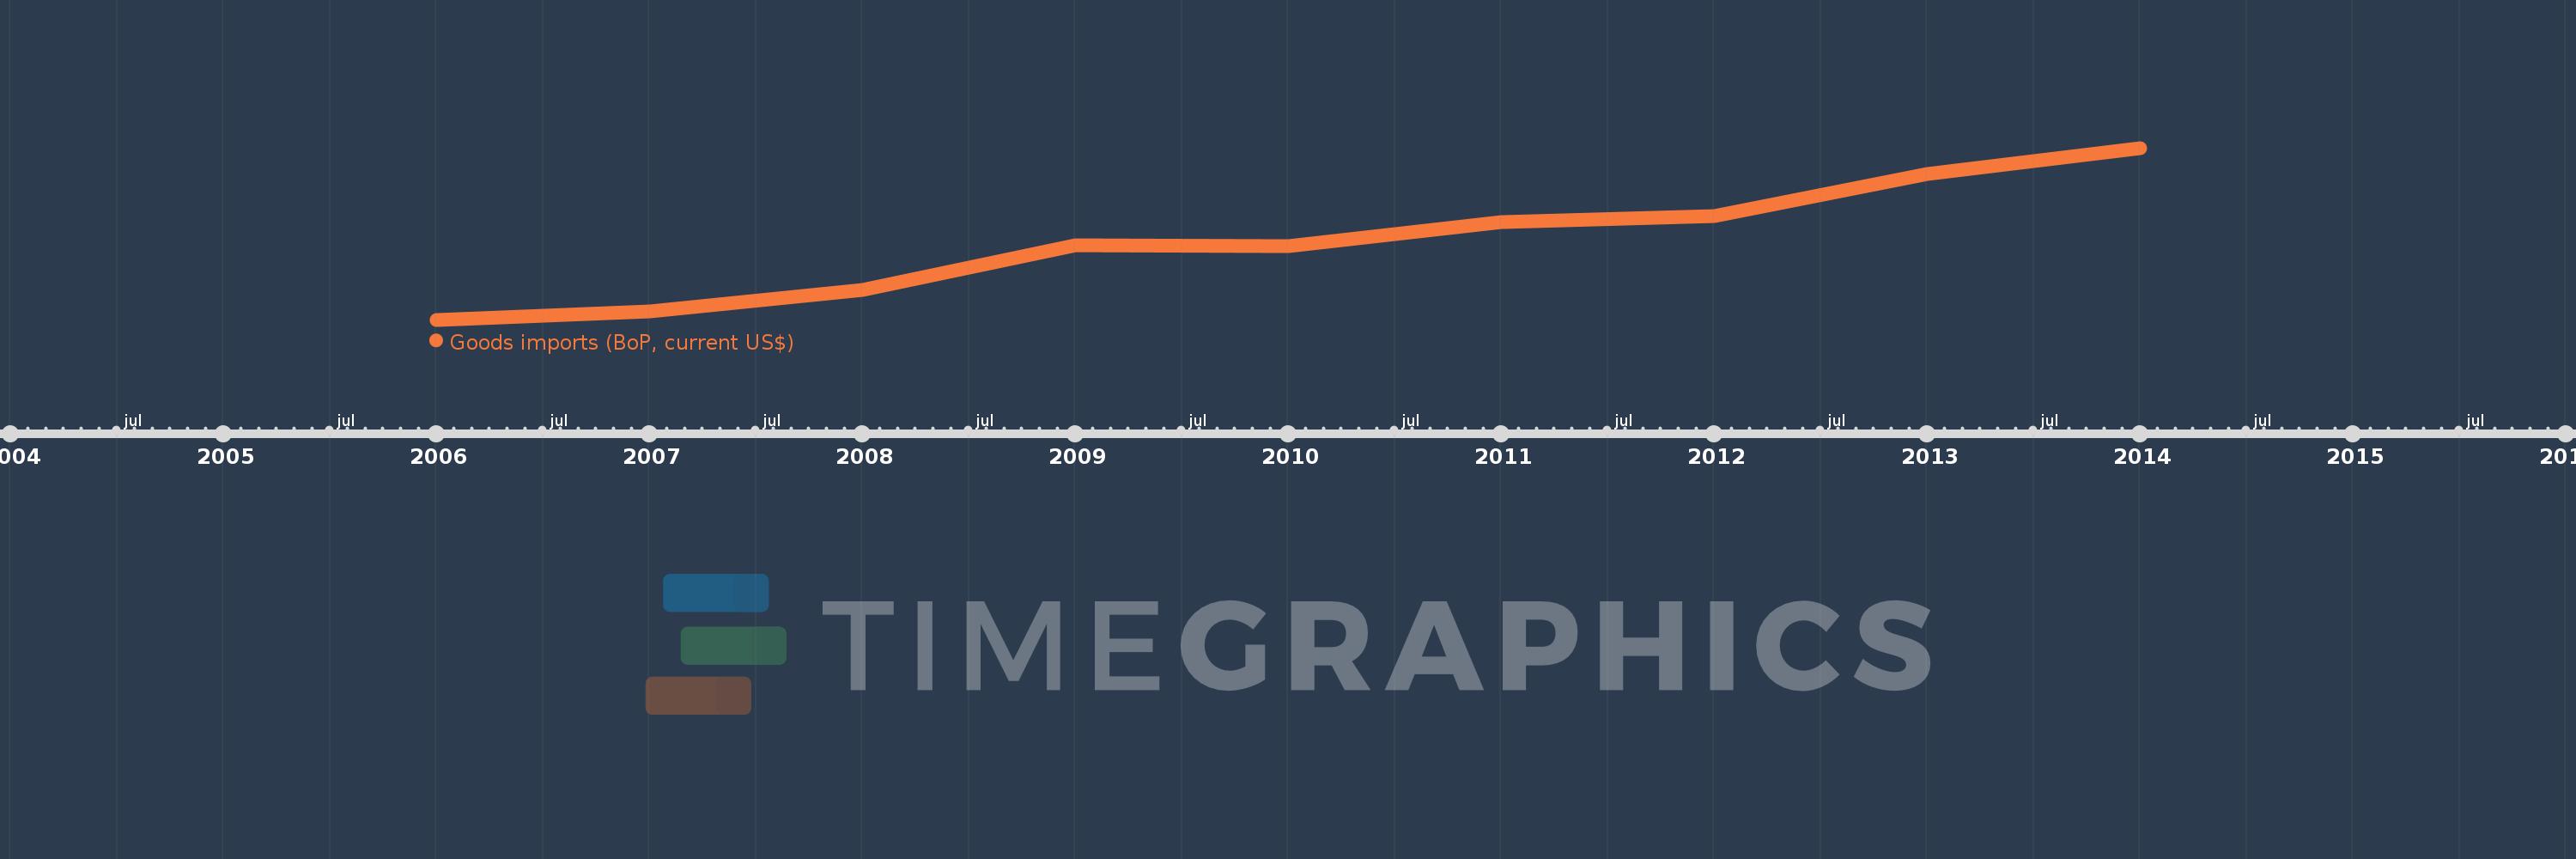
This timeline shows a graph from 2006 to 2014 of Fragile and conflict affected situations. No data until 2005. Number of actual observations by date: 9.
Source name:
World Development Indicators
Source organization:
International Monetary Fund, Balance of Payments Statistics Yearbook and data files.
Categories, topics:
Economy & Growth, Trade
Last updated:
apr 23, 2017
Indicators value changes by year
Meaning:
156.321 bln
Minimum:
89.439 bln
jan 1, 2006
Maximum:
236.176 bln
jan 1, 2014
At the date of observation
Value
Absolute change
Change from the previous value
jan 1, 2006
89.439 bln
+89.439 bln
0.0%
jan 1, 2007
96.298 bln
+6.859 bln
7.67%
jan 1, 2008
114.881 bln
+18.583 bln
19.3%
jan 1, 2009
152.746 bln
+37.865 bln
32.96%
jan 1, 2010
152.381 bln
-365.658 mln
-0.24%
jan 1, 2011
173.18 bln
+20.799 bln
13.65%
jan 1, 2012
178.151 bln
+4.971 bln
2.87%
jan 1, 2013
213.634 bln
+35.484 bln
19.92%
jan 1, 2014
236.176 bln
+22.541 bln
10.55%
Ranking of countries by current statistics by years