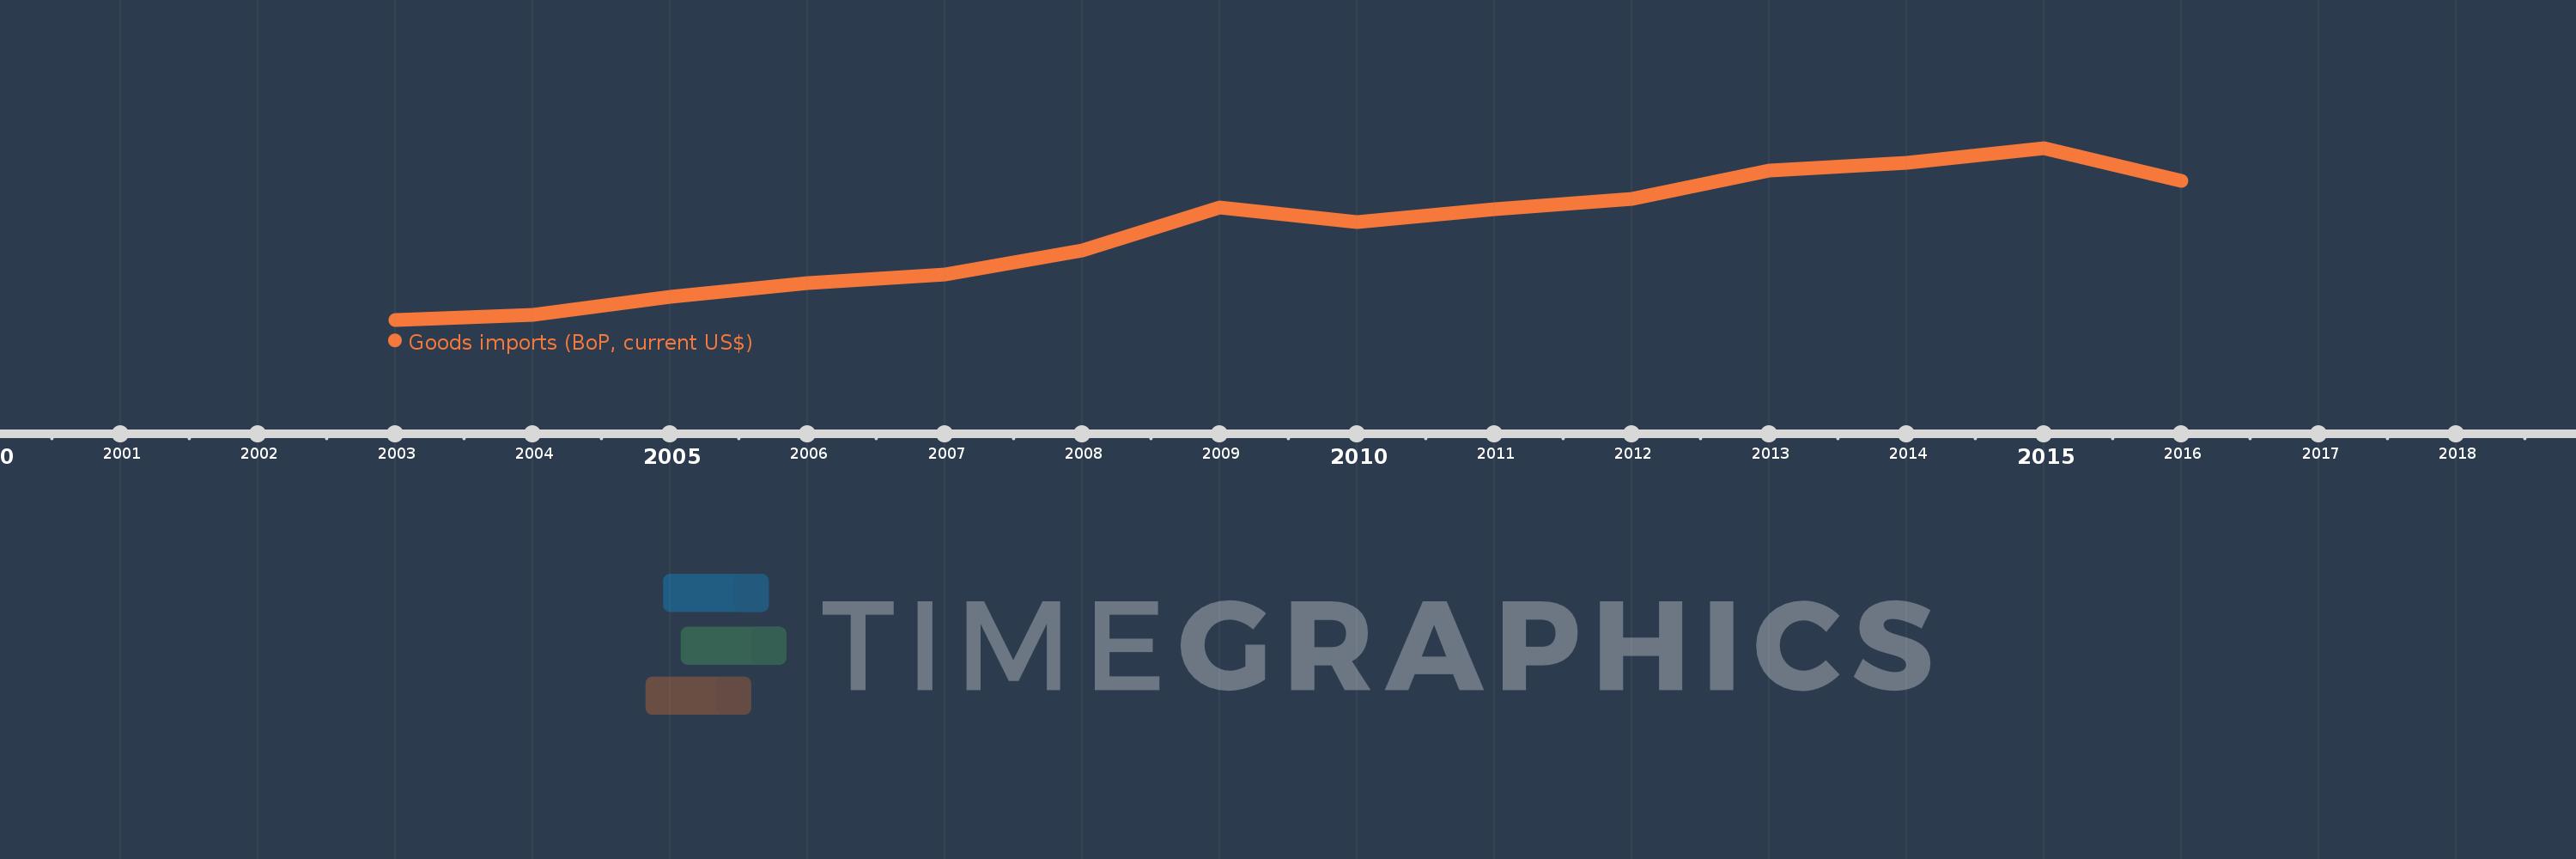
This timeline shows a graph from 2003 to 2016 of Middle East & North Africa (excluding high income). No data until 2002. Number of actual observations by date: 14.
Source name:
World Development Indicators
Source organization:
International Monetary Fund, Balance of Payments Statistics Yearbook and data files.
Categories, topics:
Economy & Growth, Trade
Last updated:
apr 23, 2017
Indicators value changes by year
Meaning:
273.366 bln
Minimum:
100.698 bln
jan 1, 2003
Maximum:
436.214 bln
jan 1, 2015
At the date of observation
Value
Absolute change
Change from the previous value
jan 1, 2003
100.698 bln
+100.698 bln
0.0%
jan 1, 2004
109.828 bln
+9.13 bln
9.07%
jan 1, 2005
145.81 bln
+35.982 bln
32.76%
jan 1, 2006
172.101 bln
+26.291 bln
18.03%
jan 1, 2007
189.302 bln
+17.201 bln
9.99%
jan 1, 2008
236.832 bln
+47.53 bln
25.11%
jan 1, 2009
320.697 bln
+83.866 bln
35.41%
jan 1, 2010
290.714 bln
-29.983 bln
-9.35%
jan 1, 2011
317.004 bln
+26.29 bln
9.04%
jan 1, 2012
337.214 bln
+20.21 bln
6.38%
jan 1, 2013
391.406 bln
+54.192 bln
16.07%
jan 1, 2014
407.751 bln
+16.345 bln
4.18%
jan 1, 2015
436.214 bln
+28.463 bln
6.98%
jan 1, 2016
371.553 bln
-64.66 bln
-14.82%
Ranking of countries by current statistics by years