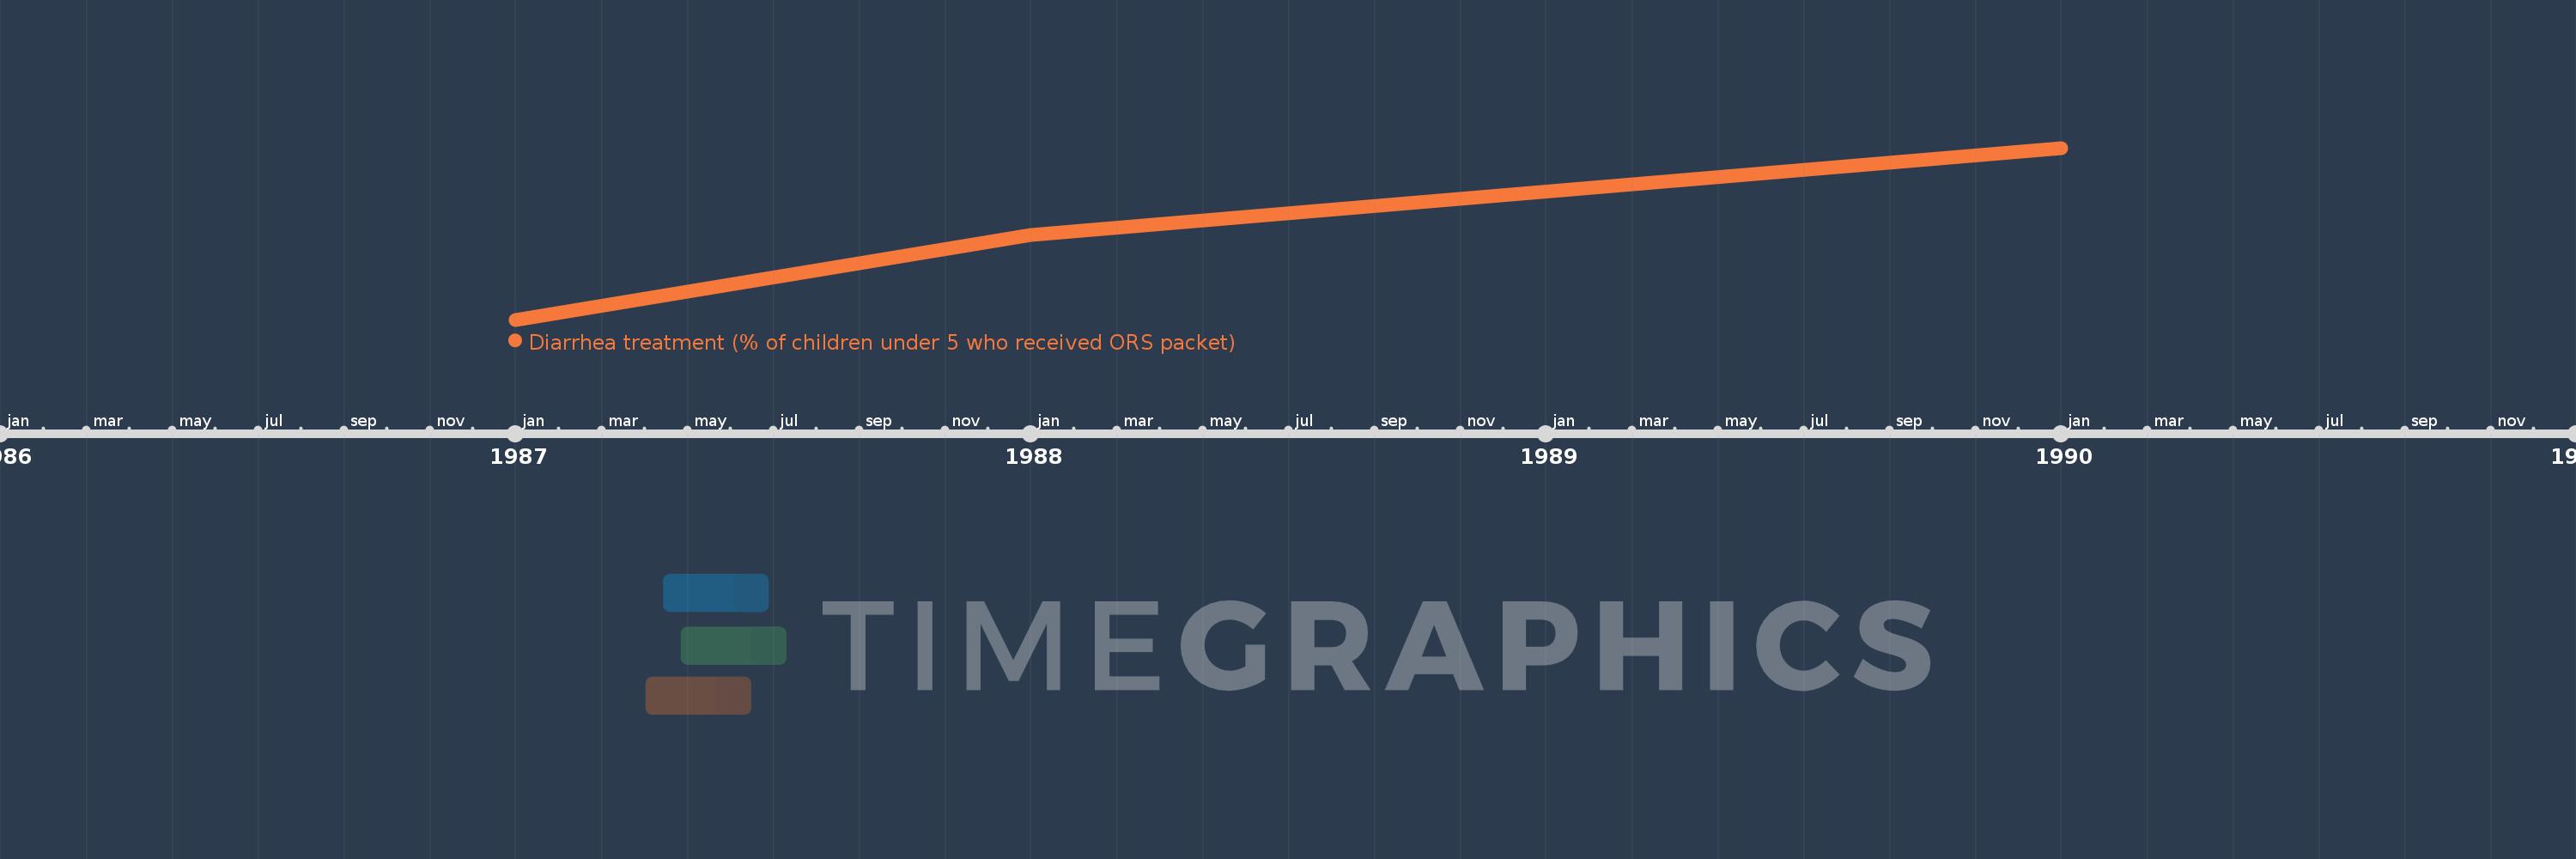
This timeline shows a graph from 1987 to 1990 of Middle East & North Africa (IDA & IBRD countries). No data until 1986. Number of actual observations by date: 3.
Source name:
World Development Indicators
Source organization:
UNICEF, State of the World's Children, Childinfo, and Demographic and Health Surveys.
Categories, topics:
Health
Last updated:
apr 23, 2017
Indicators value changes by year
Meaning:
43.384
Minimum:
29.242
jan 1, 1987
Maximum:
57.607
jan 1, 1990
At the date of observation
Value
Absolute change
Change from the previous value
jan 1, 1987
29.242
+29.242
0.0%
jan 1, 1988
43.302
+14.059
48.08%
jan 1, 1990
57.607
+14.306
33.04%
Ranking of countries by current statistics by years