Download This statistics in other country:
Timeline:
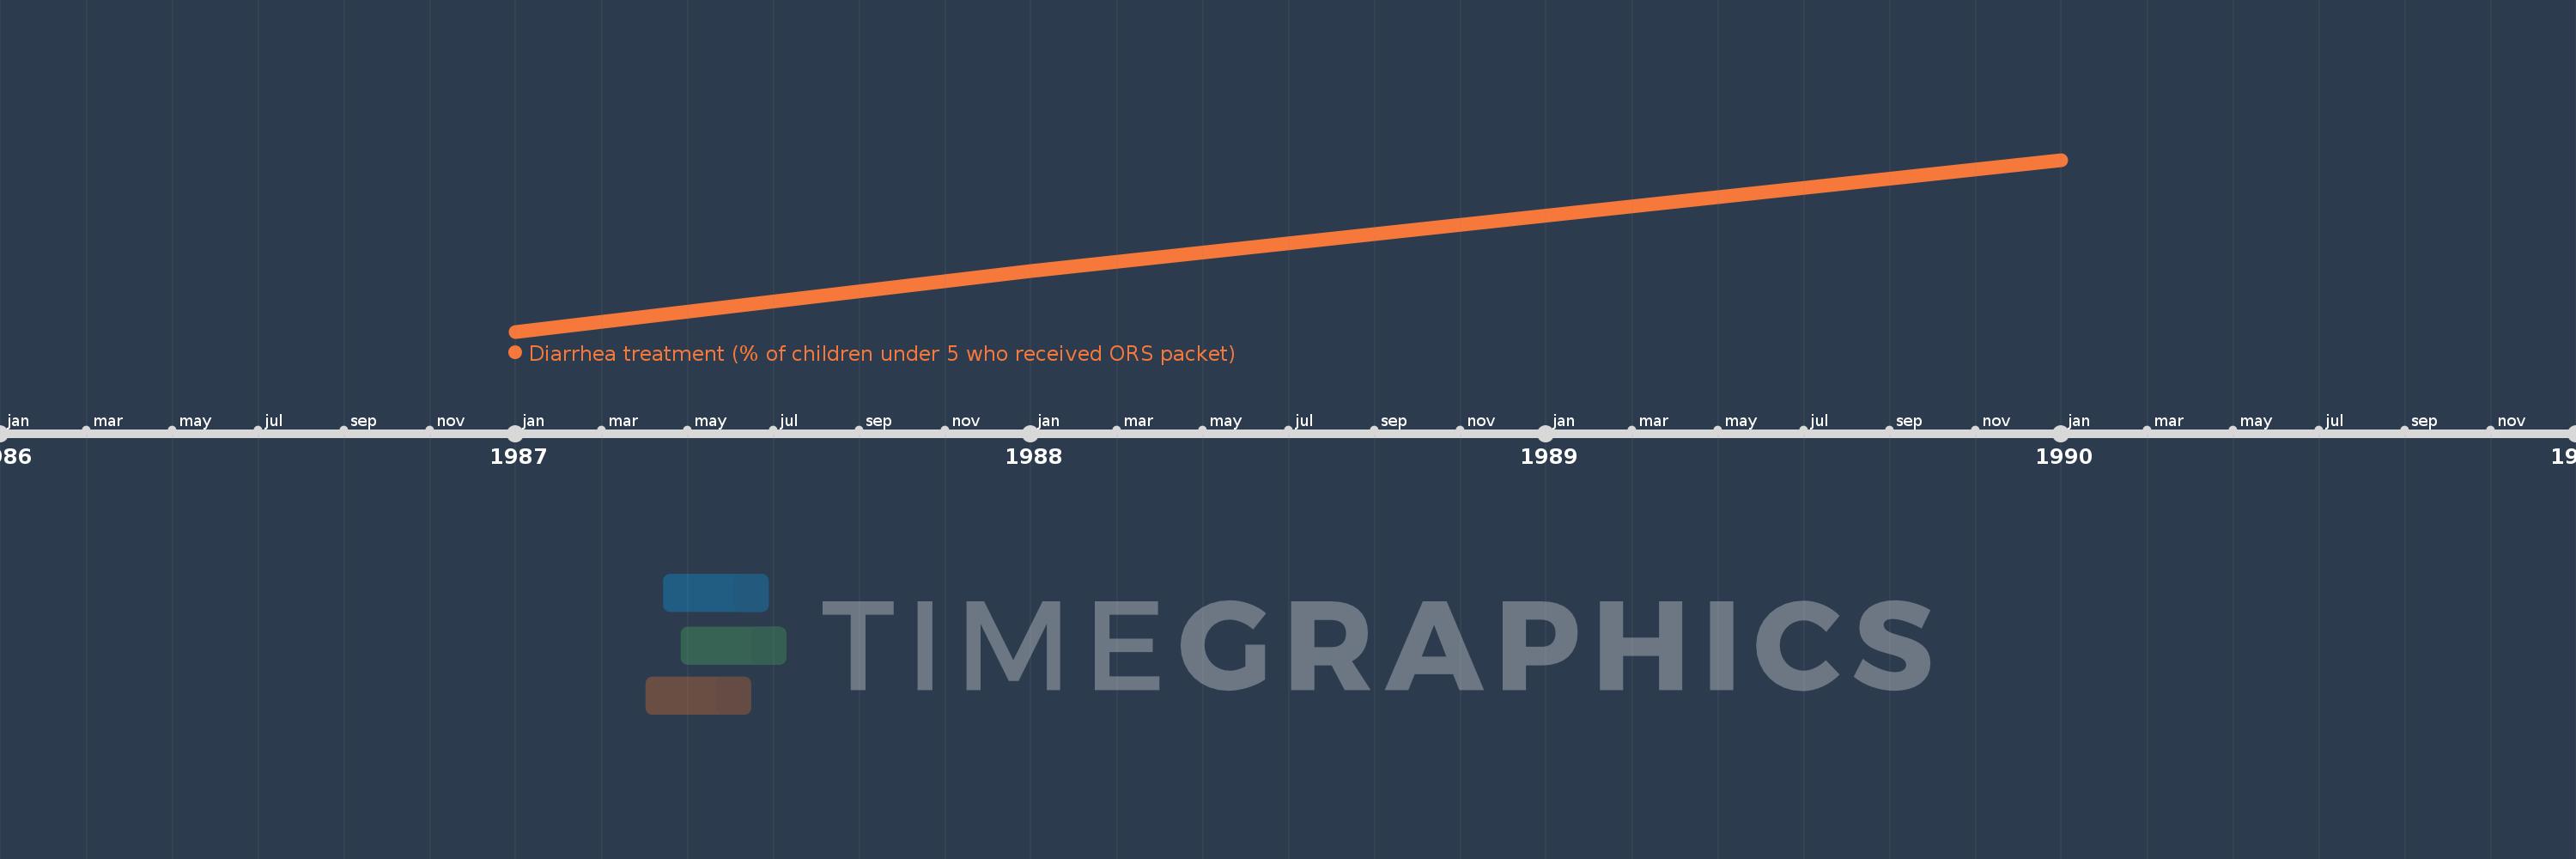
This timeline shows a graph from 1987 to 1990 of IDA blend. No data until 1986. Number of actual observations by date: 3.
Source name:
World Development Indicators
Source organization:
UNICEF, State of the World's Children, Childinfo, and Demographic and Health Surveys.
Categories, topics:
Health
Last updated:
apr 23, 2017
Indicators value changes by year
Minimum:
27.431
jan 1, 1987
Maximum:
47.556
jan 1, 1990
At the date of observation
Value
Absolute change
Change from the previous value
jan 1, 1987
27.431
+27.431
0.0%
jan 1, 1988
34.567
+7.136
26.01%
jan 1, 1990
47.556
+12.988
37.57%
Ranking of countries by current statistics by years