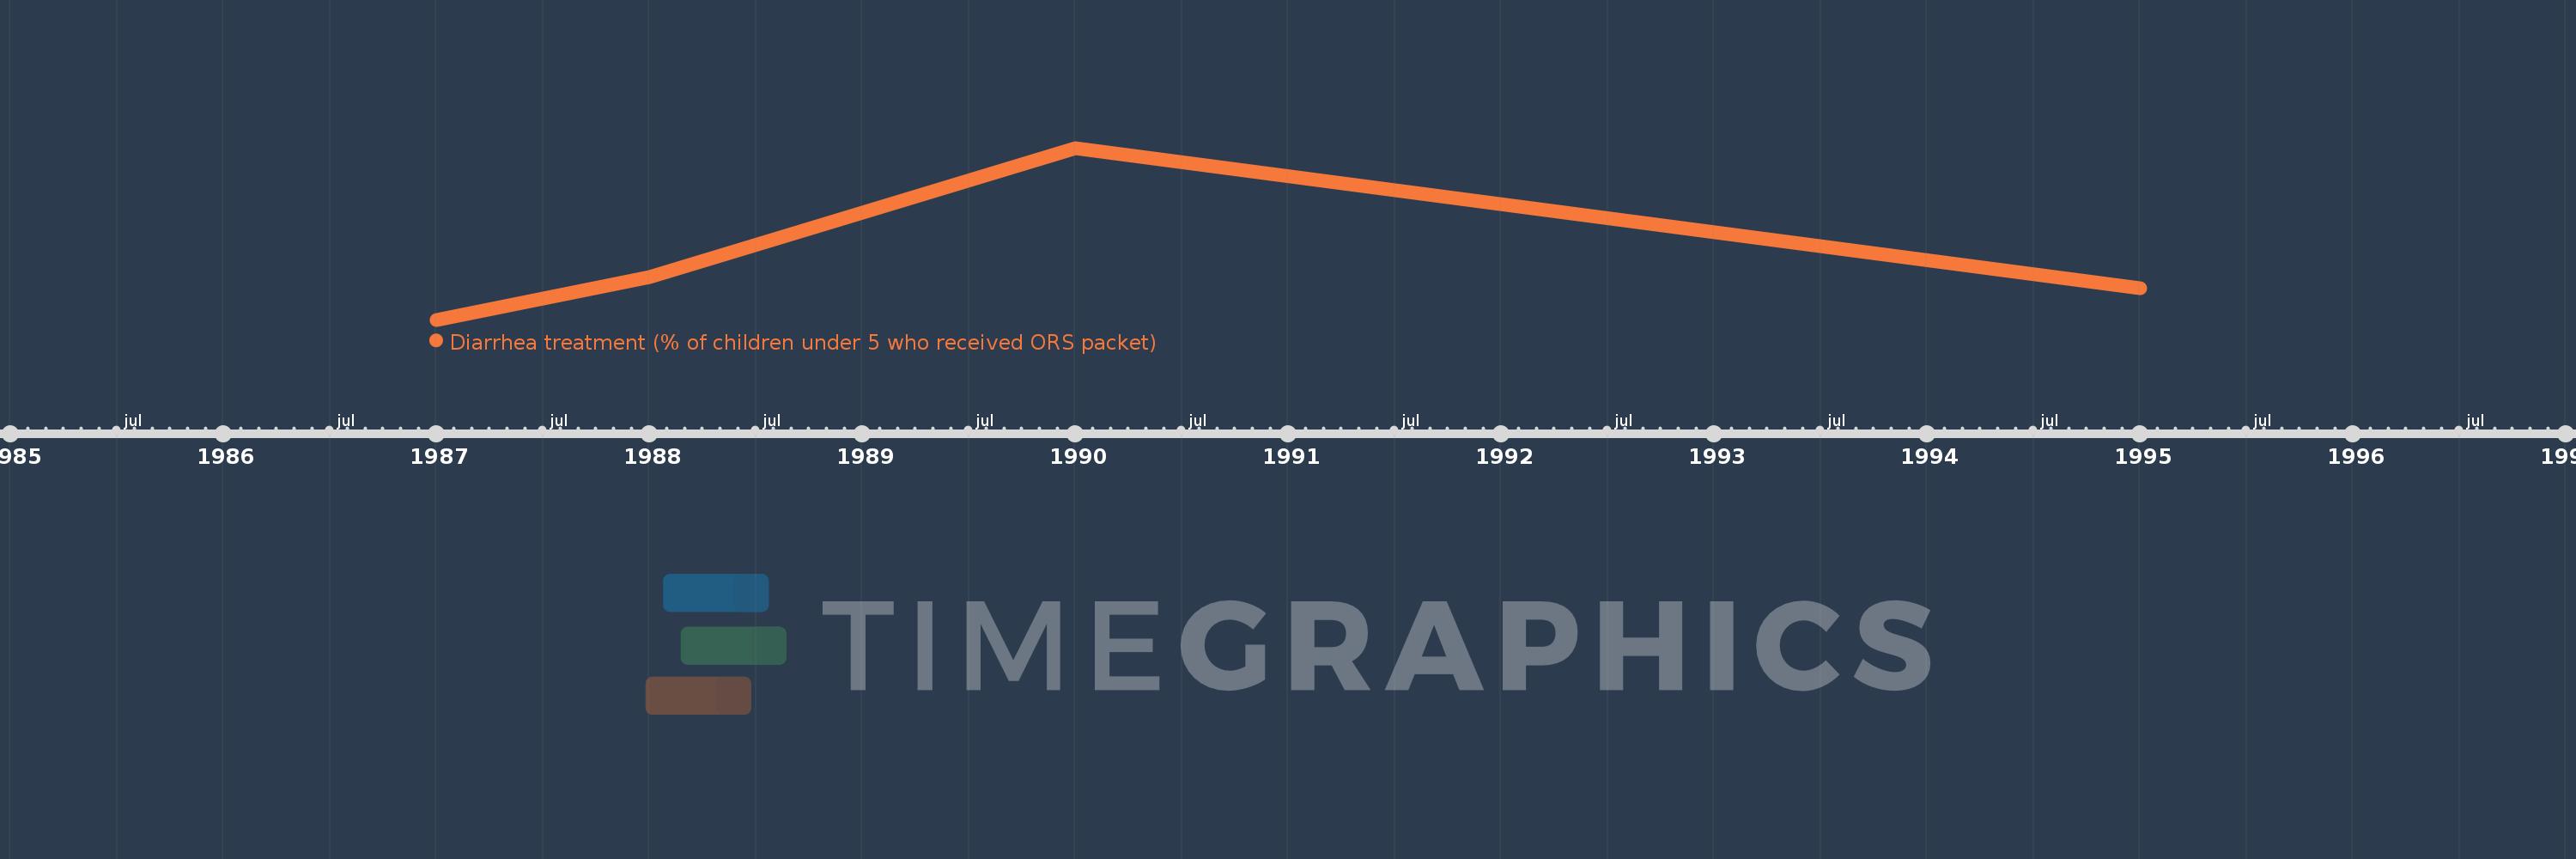
This timeline shows a graph from 1987 to 1995 of East Asia & Pacific (IDA & IBRD countries). No data until 1986. Number of actual observations by date: 4.
Source name:
World Development Indicators
Source organization:
UNICEF, State of the World's Children, Childinfo, and Demographic and Health Surveys.
Categories, topics:
Health
Last updated:
apr 23, 2017
Indicators value changes by year
Meaning:
21.569
Minimum:
11.749
jan 1, 1987
Maximum:
39.15
jan 1, 1990
At the date of observation
Value
Absolute change
Change from the previous value
jan 1, 1987
11.749
+11.749
0.0%
jan 1, 1988
18.612
+6.863
58.41%
jan 1, 1990
39.15
+20.538
110.35%
jan 1, 1995
16.767
-22.382
-57.17%
Ranking of countries by current statistics by years