This timeline shows a graph from 2006 to 2016 of 
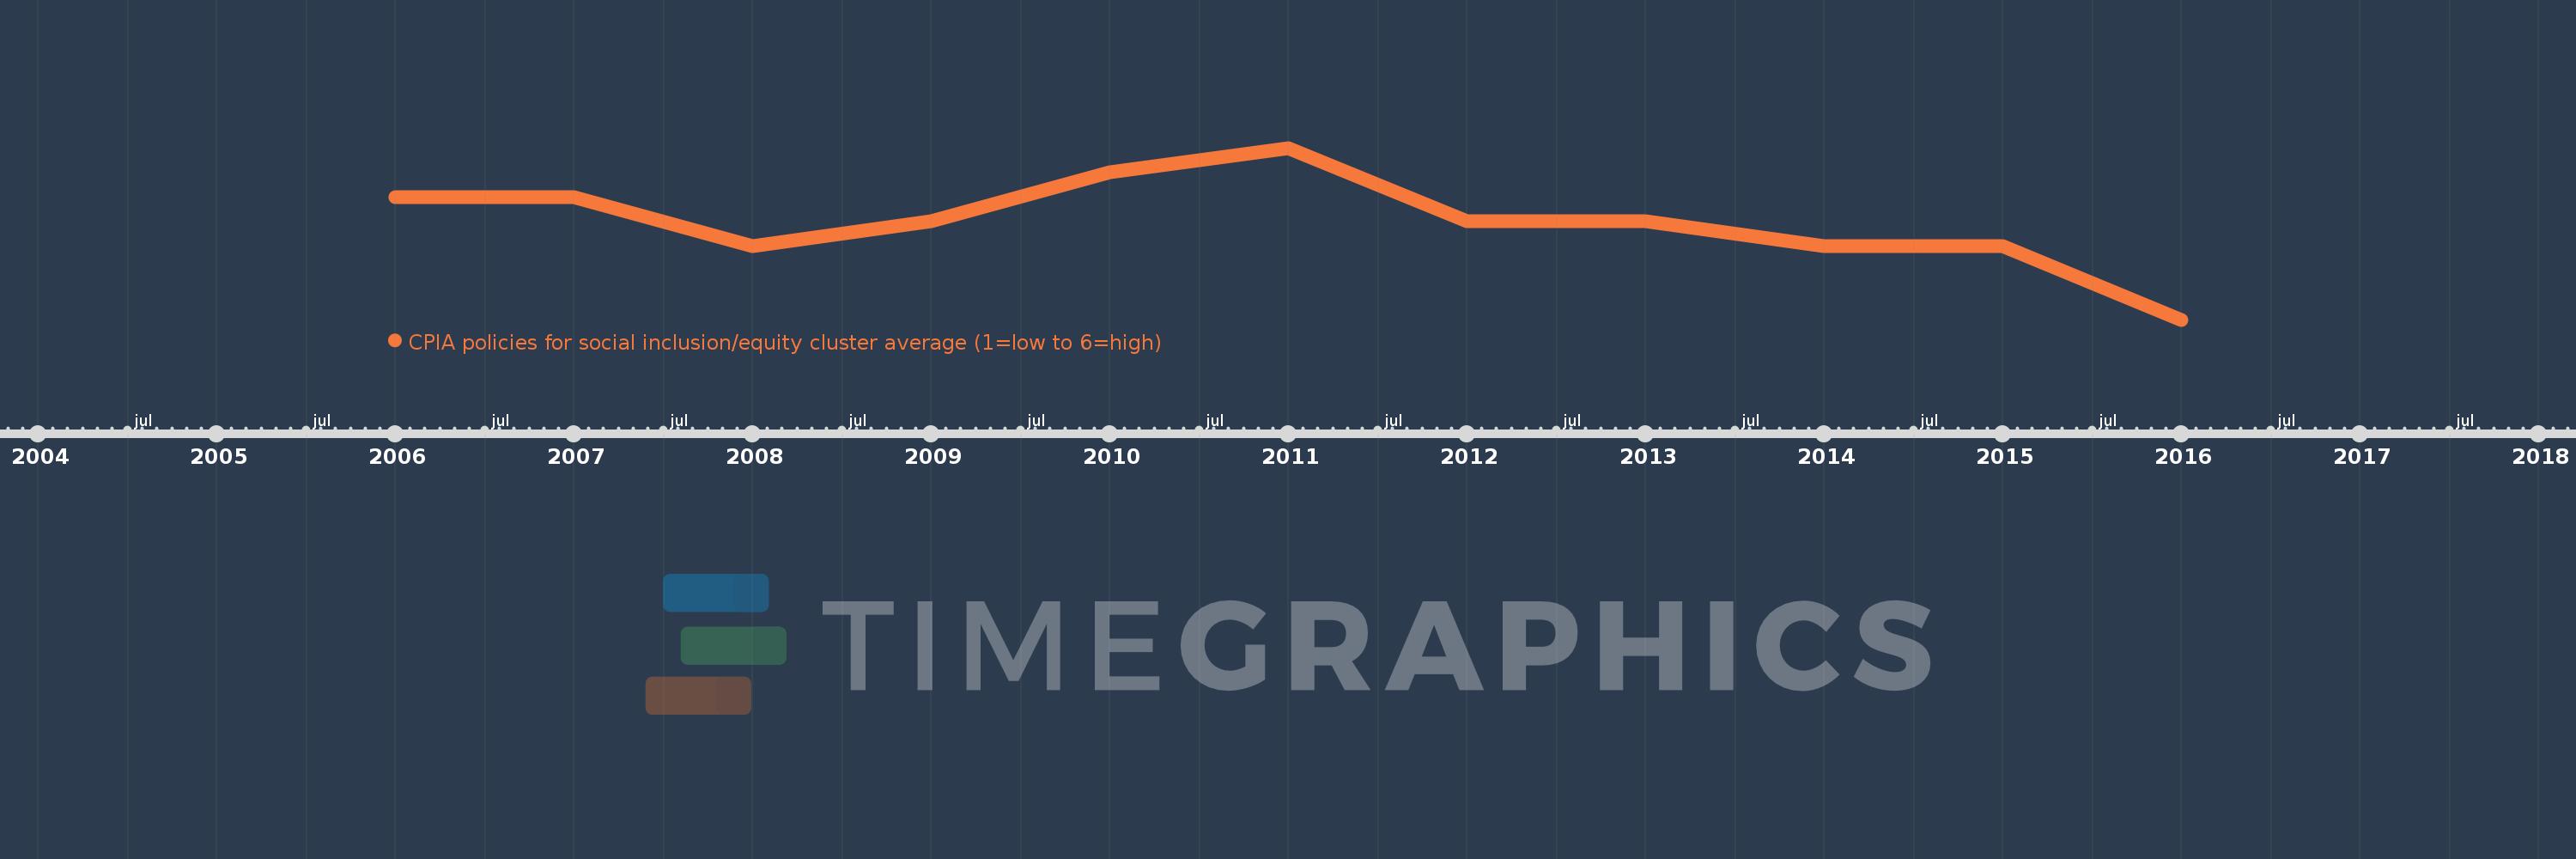
Middle East & North Africa (IDA & IBRD countries). No data until 2005. Number of actual observations by date: 11.
Source name:
World Development Indicators
Source organization:
World Bank Group, CPIA database (http://www.worldbank.org/ida).
Categories, topics:
Public Sector
Last updated:
apr 23, 2017
Indicators value changes by year
Meaning:
3.05
Minimum:
2.85
jan 1, 2016
Maximum:
3.2
jan 1, 2011
At the date of observation
Value
Absolute change
Change from the previous value
jan 1, 2006
3.1
+3.1
0.0%
jan 1, 2007
3.1
0.0
0.0%
jan 1, 2008
3.0
-0.1
-3.23%
jan 1, 2009
3.05
+0.05
1.67%
jan 1, 2010
3.15
+0.1
3.28%
jan 1, 2011
3.2
+0.05
1.59%
jan 1, 2012
3.05
-0.15
-4.69%
jan 1, 2013
3.05
0.0
0.0%
jan 1, 2014
3.0
-0.05
-1.64%
jan 1, 2015
3.0
0.0
0.0%
jan 1, 2016
2.85
-0.15
-5.0%
Ranking of countries by current statistics by years