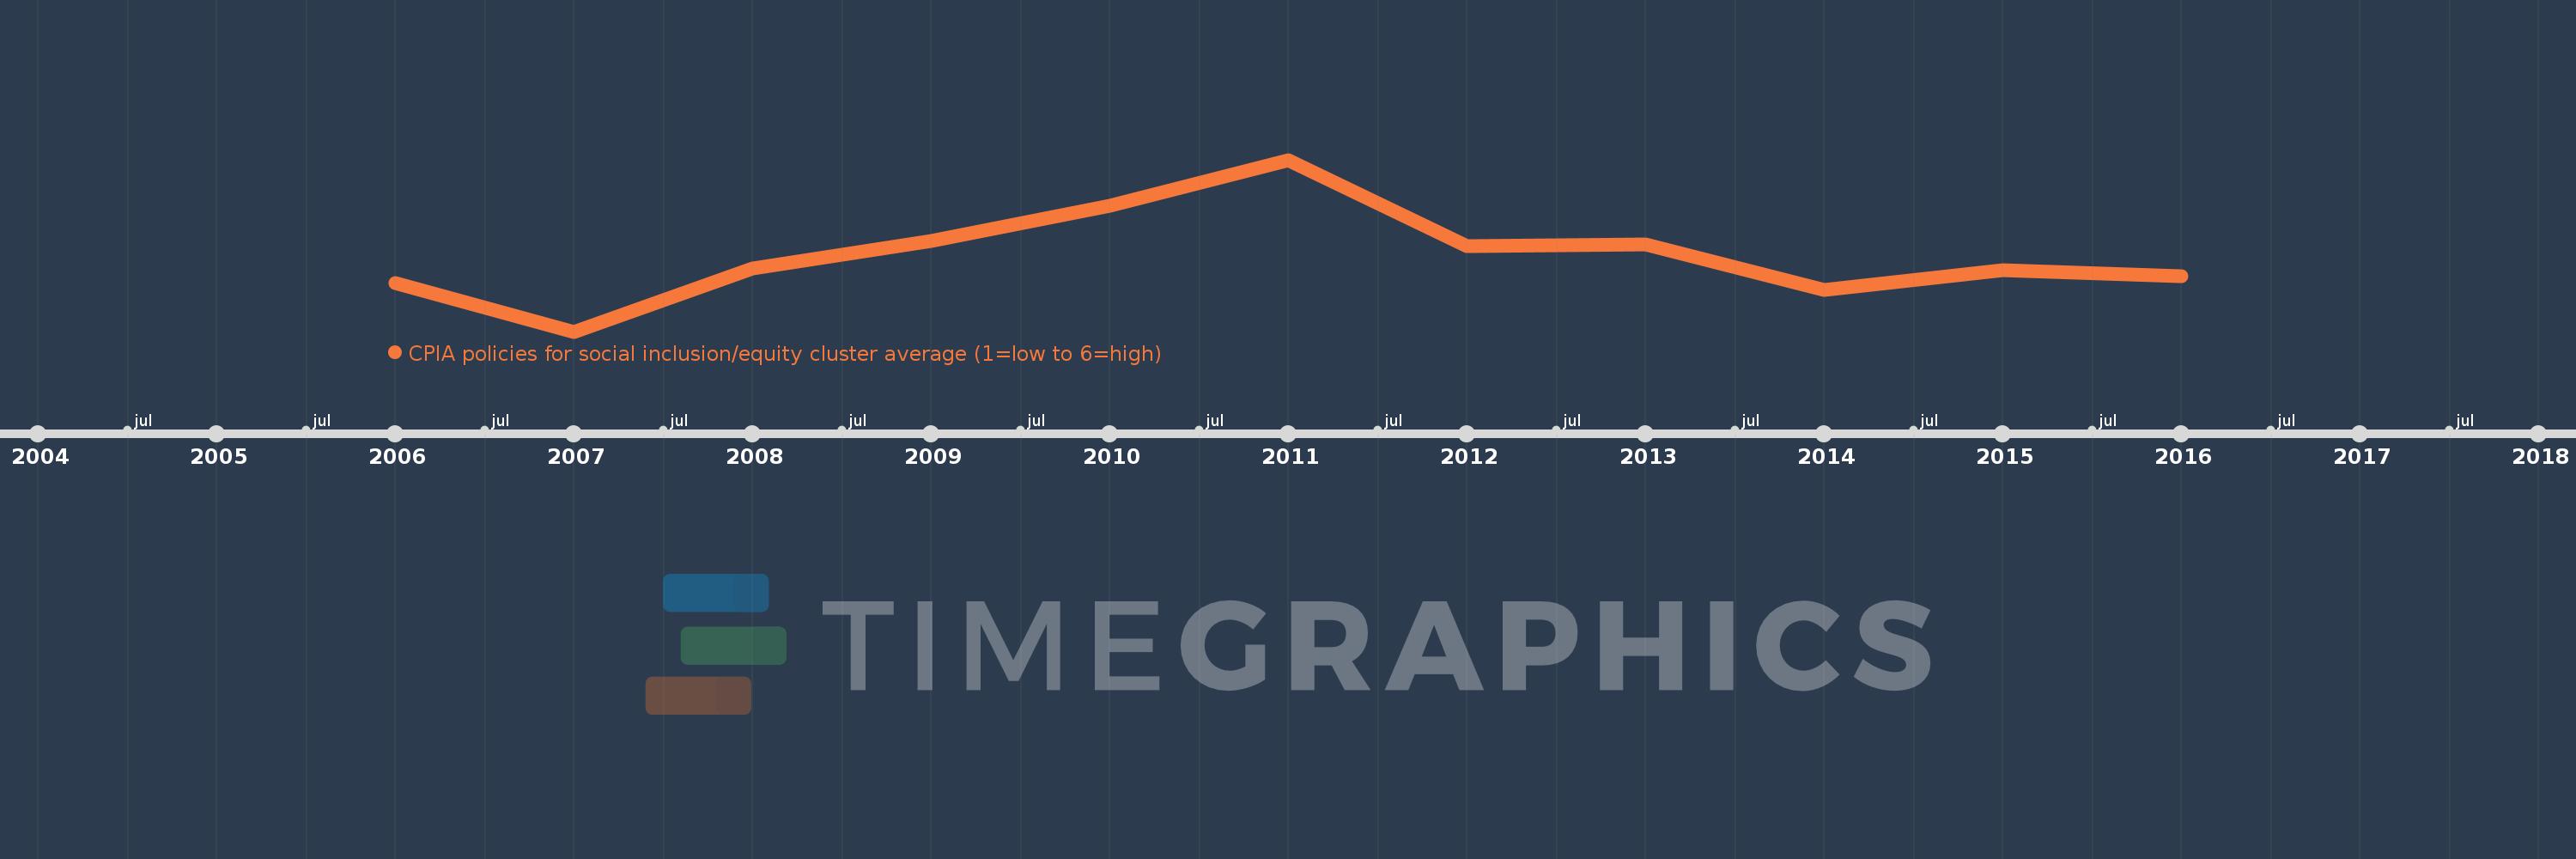
This timeline shows a graph from 2006 to 2016 of East Asia & Pacific (IDA & IBRD countries). No data until 2005. Number of actual observations by date: 11.
Source name:
World Development Indicators
Source organization:
World Bank Group, CPIA database (http://www.worldbank.org/ida).
Categories, topics:
Public Sector
Last updated:
apr 23, 2017
Indicators value changes by year
Meaning:
3.167
Minimum:
3.091
jan 1, 2007
Maximum:
3.264
jan 1, 2011
At the date of observation
Value
Absolute change
Change from the previous value
jan 1, 2006
3.14
+3.14
0.0%
jan 1, 2007
3.091
-0.049
-1.56%
jan 1, 2008
3.155
+0.064
2.06%
jan 1, 2009
3.182
+0.027
0.86%
jan 1, 2010
3.218
+0.036
1.14%
jan 1, 2011
3.264
+0.045
1.41%
jan 1, 2012
3.177
-0.087
-2.66%
jan 1, 2013
3.179
+0.002
0.05%
jan 1, 2014
3.133
-0.045
-1.42%
jan 1, 2015
3.153
+0.02
0.64%
jan 1, 2016
3.147
-0.007
-0.21%
Ranking of countries by current statistics by years