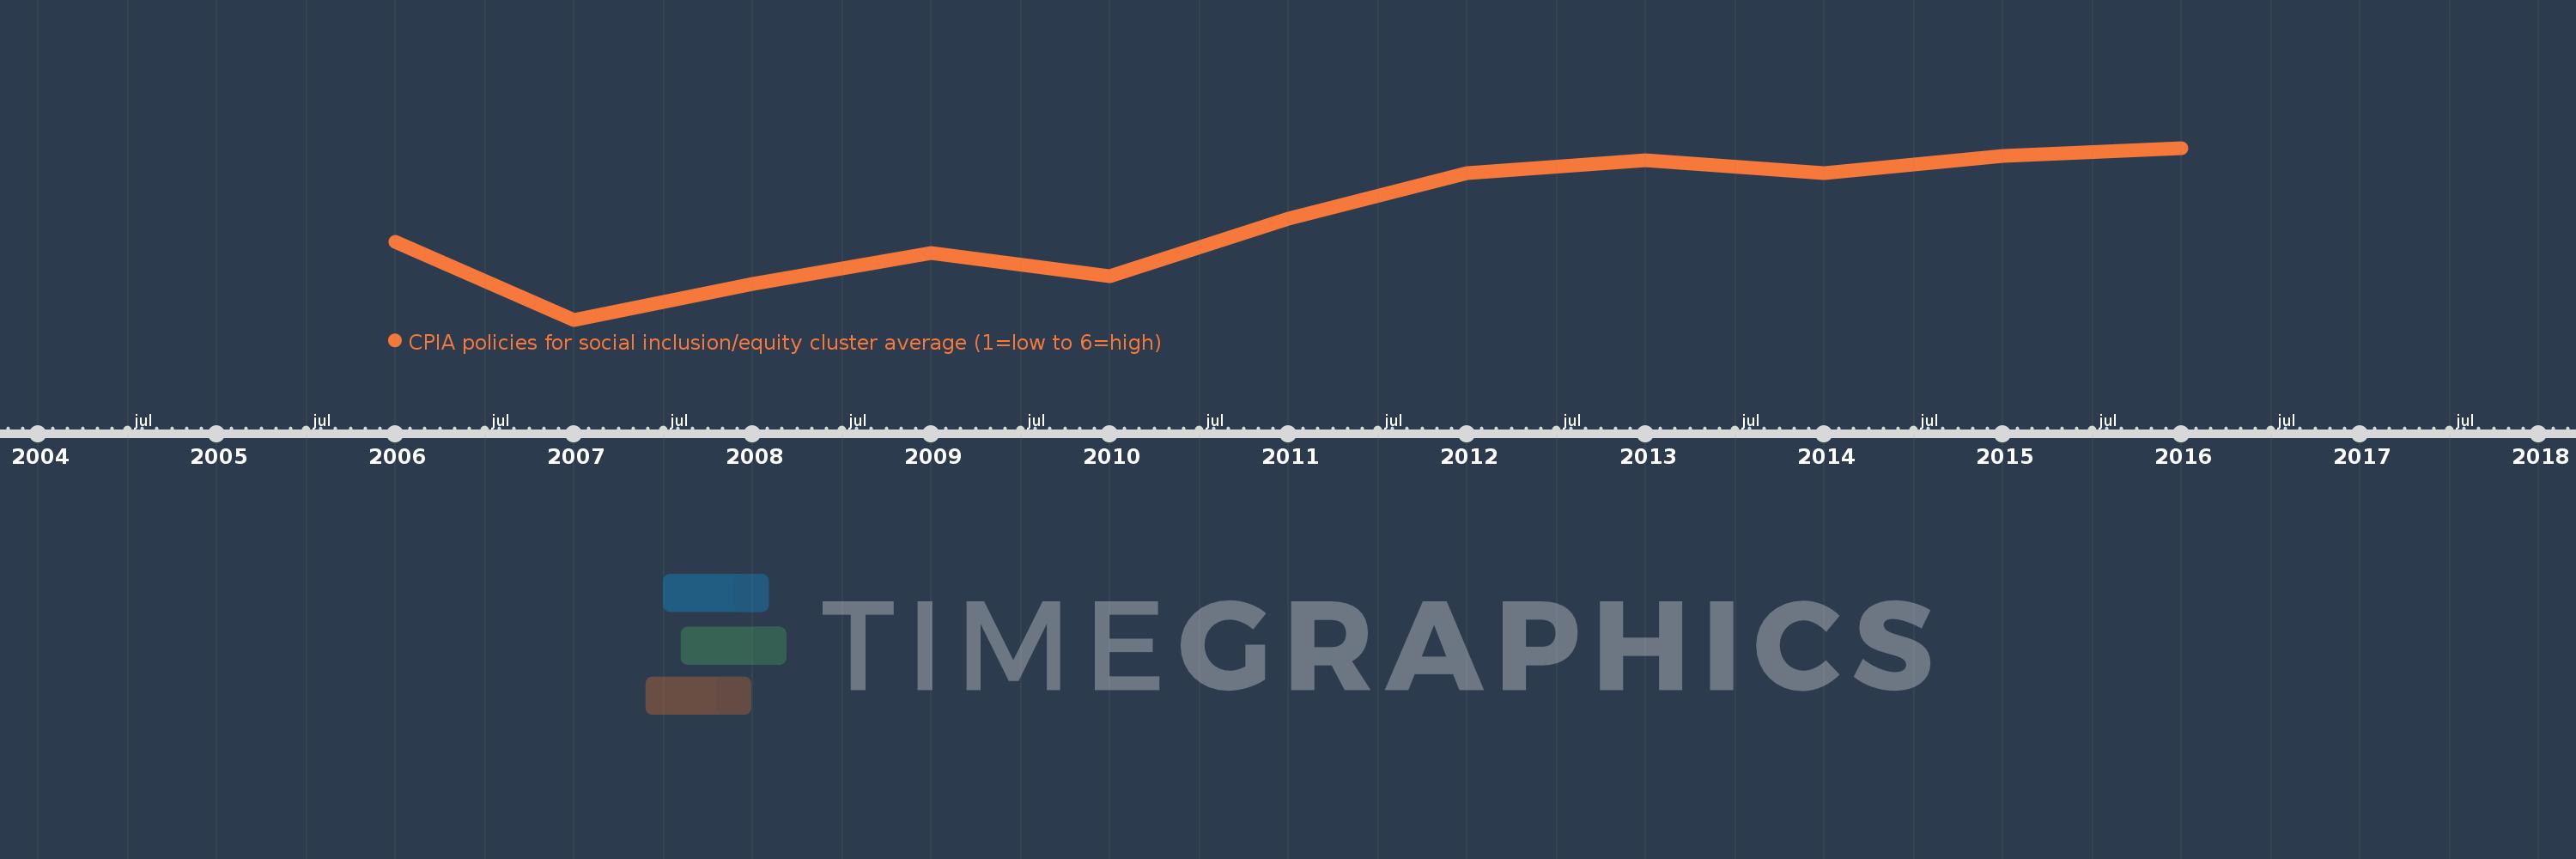
This timeline shows a graph from 2006 to 2016 of Heavily indebted poor countries (HIPC). No data until 2005. Number of actual observations by date: 11.
Source name:
World Development Indicators
Source organization:
World Bank Group, CPIA database (http://www.worldbank.org/ida).
Categories, topics:
Public Sector
Last updated:
apr 23, 2017
Indicators value changes by year
Meaning:
3.184
Minimum:
3.119
jan 1, 2007
Maximum:
3.229
jan 1, 2016
At the date of observation
Value
Absolute change
Change from the previous value
jan 1, 2006
3.169
+3.169
0.0%
jan 1, 2007
3.119
-0.049
-1.55%
jan 1, 2008
3.142
+0.022
0.71%
jan 1, 2009
3.162
+0.02
0.65%
jan 1, 2010
3.147
-0.015
-0.47%
jan 1, 2011
3.184
+0.037
1.17%
jan 1, 2012
3.213
+0.029
0.91%
jan 1, 2013
3.221
+0.008
0.25%
jan 1, 2014
3.213
-0.008
-0.25%
jan 1, 2015
3.224
+0.011
0.33%
jan 1, 2016
3.229
+0.005
0.16%
Ranking of countries by current statistics by years