Download This statistics in other country:
Timeline:
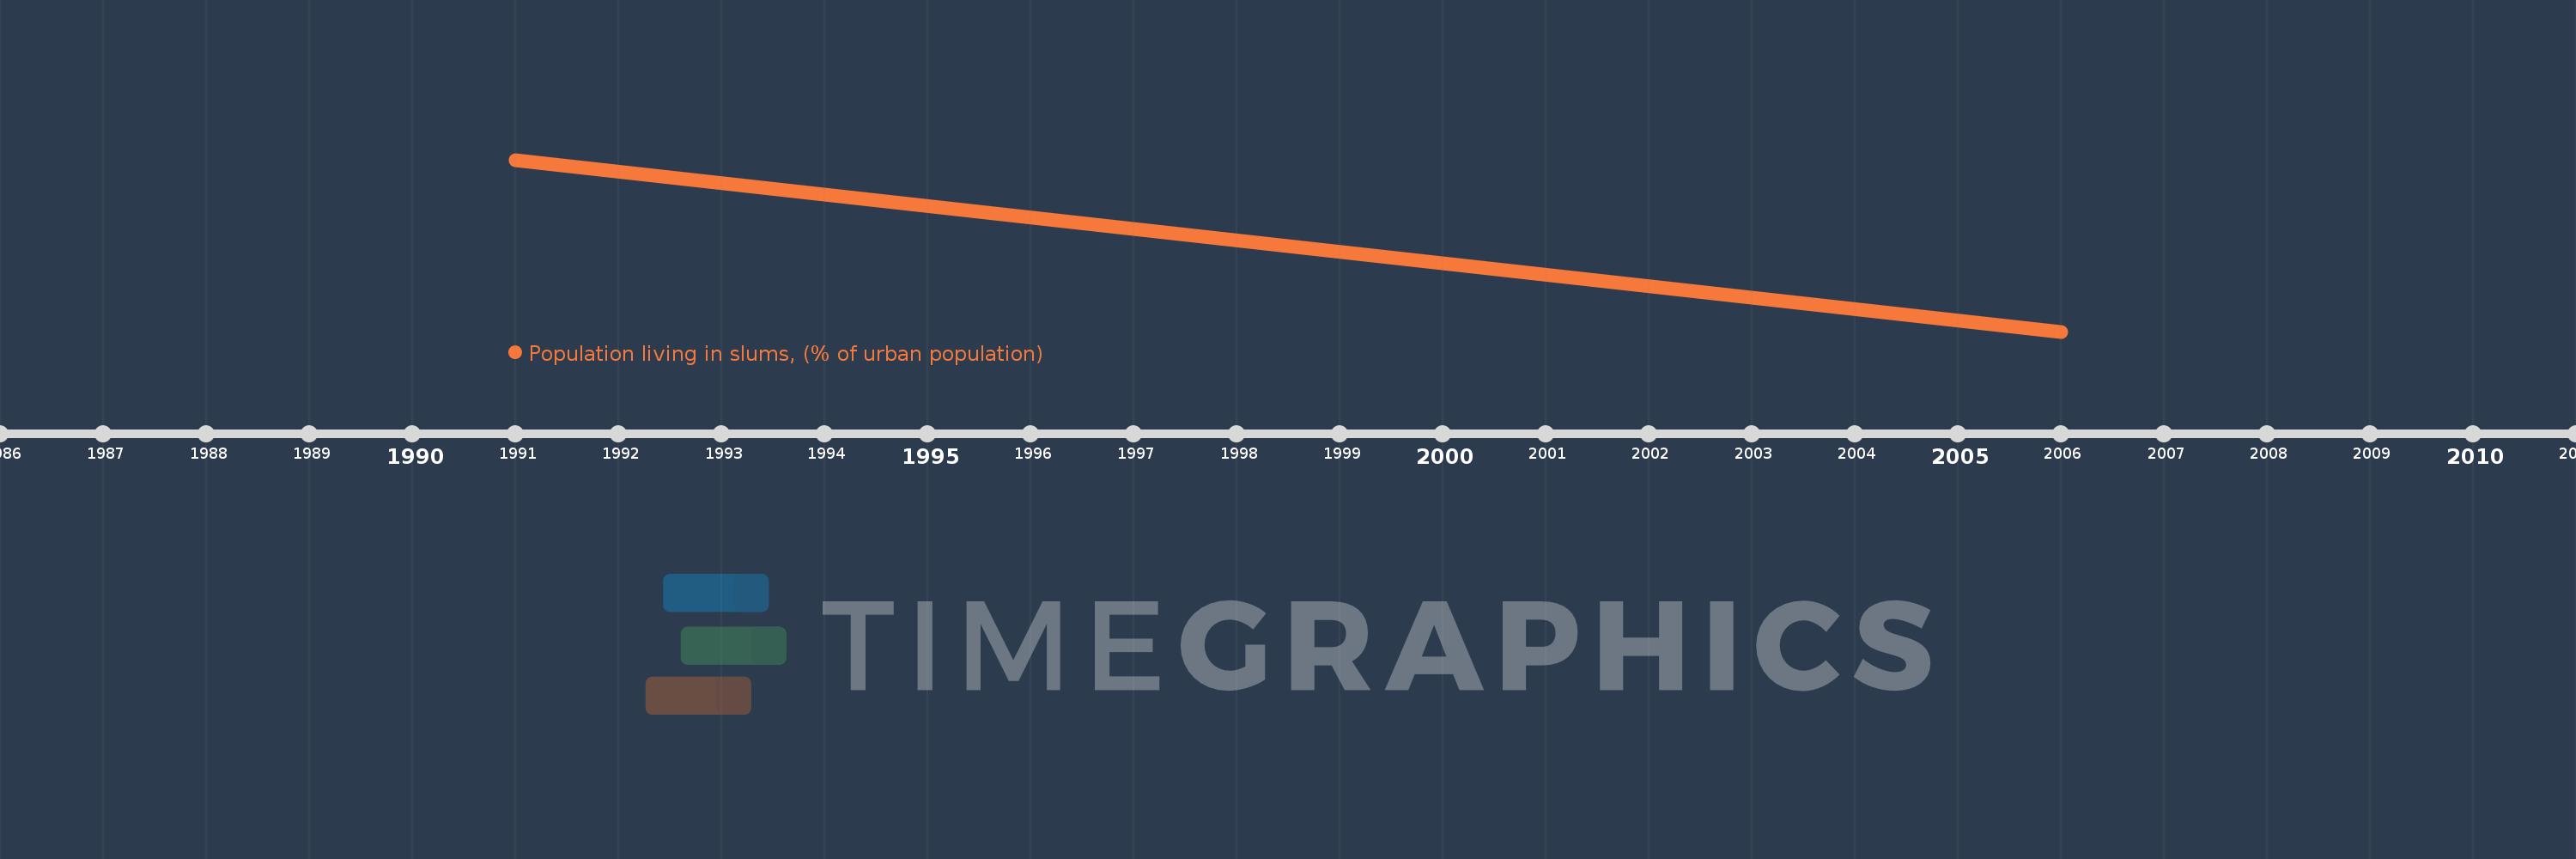
This timeline shows a graph from 1991 to 2006 of Middle East & North Africa (excluding high income). No data until 1990. Number of actual observations by date: 2.
Source name:
World Development Indicators
Source organization:
UN HABITAT, retrieved from the United Nation's Millennium Development Goals database. Data are available at: Http://mdgs.un.org
Categories, topics:
Poverty, Urban Development, Environment
Last updated:
apr 23, 2017
Indicators value changes by year
Minimum:
28.465
jan 1, 2006
Maximum:
39.149
jan 1, 1991
At the date of observation
Value
Absolute change
Change from the previous value
jan 1, 1991
39.149
+39.149
0.0%
jan 1, 2006
28.465
-10.683
-27.29%
Ranking of countries by current statistics by years