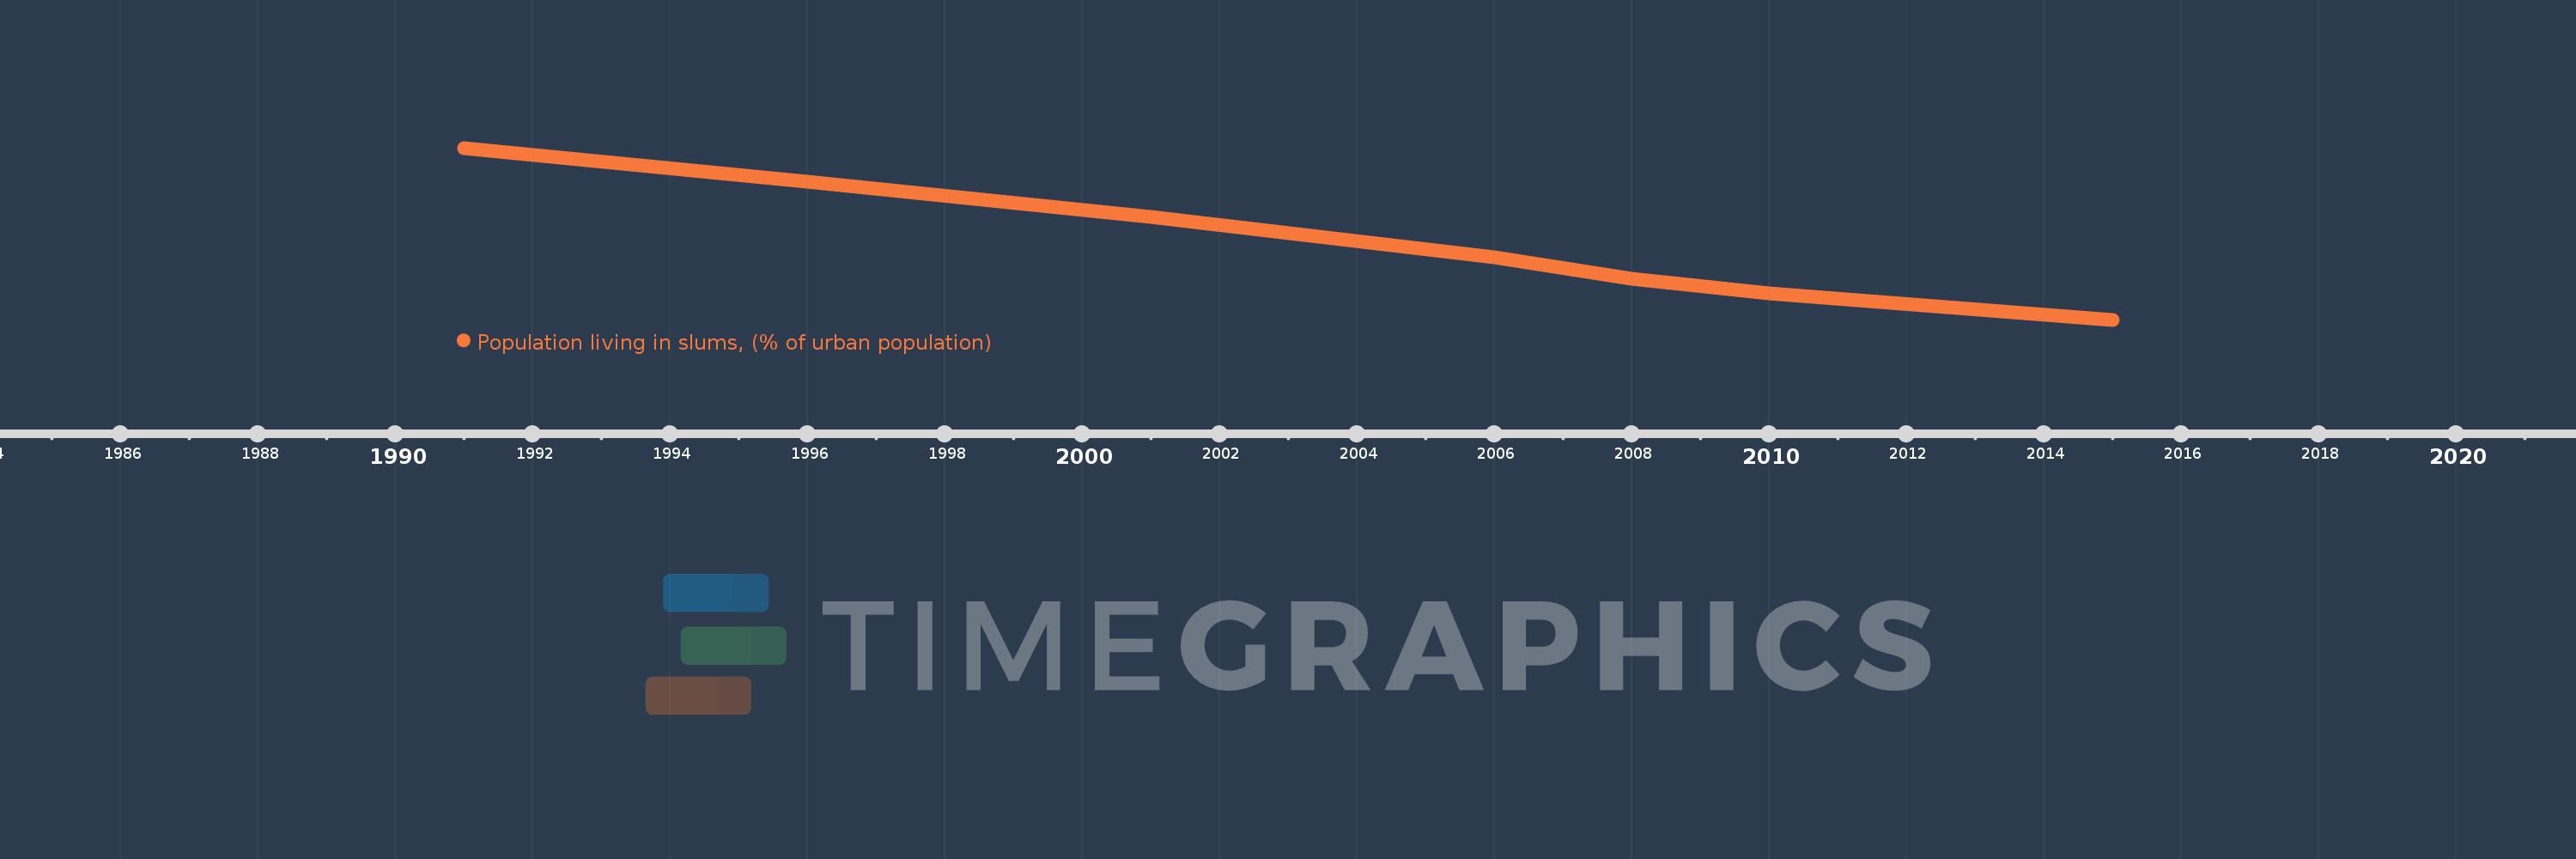
This timeline shows a graph from 1991 to 2015 of East Asia & Pacific (IDA & IBRD countries). No data until 1990. Number of actual observations by date: 7.
Source name:
World Development Indicators
Source organization:
UN HABITAT, retrieved from the United Nation's Millennium Development Goals database. Data are available at: Http://mdgs.un.org
Categories, topics:
Poverty, Urban Development, Environment
Last updated:
apr 23, 2017
Indicators value changes by year
Meaning:
34.924
Minimum:
25.795
jan 1, 2015
Maximum:
46.044
jan 1, 1991
At the date of observation
Value
Absolute change
Change from the previous value
jan 1, 1991
46.044
+46.044
0.0%
jan 1, 1996
42.027
-4.017
-8.72%
jan 1, 2001
37.913
-4.114
-9.79%
jan 1, 2006
33.134
-4.779
-12.61%
jan 1, 2008
30.6
-2.534
-7.65%
jan 1, 2010
28.952
-1.648
-5.39%
jan 1, 2015
25.795
-3.157
-10.9%
Ranking of countries by current statistics by years