33
/
AIzaSyB4mHJ5NPEv-XzF7P6NDYXjlkCWaeKw5bc
November 30, 2025
41822
Latin America & Caribbean
LCN
false
2
1
Population living in slums, (% of urban population)
2015,2008,2006,2001,1996,1991
Create a timeline
Public Timelines
For education
For educational institutions
For teachers
For students
Cabinet
For educational institutions
For teachers
For students
Open cabinet
FAQ
Close
Create a timeline
Public timelines
FAQ
About & Feedback
Terms
Privacy
FAQ
Support 24/7
Cabinet
Get premium
Donate
Download
Global statistics library
→
Latin America & Caribbean
→
Population living in slums, (% of urban population)
This statistics in other country:
Afghanistan
Algeria
Angola
Antigua and Barbuda
Arab World
Argentina
Armenia
Bangladesh
Belize
Benin
Bhutan
Bolivia
Botswana
Brazil
Burkina Faso
Burundi
Cabo Verde
Cambodia
Cameroon
Caribbean small states
Central African Republic
Chad
Chile
China
Colombia
Comoros
Congo, Dem. Rep.
Congo, Rep.
Costa Rica
Cote d'Ivoire
Djibouti
Dominica
Dominican Republic
Early-demographic dividend
East Asia & Pacific
East Asia & Pacific (excluding high income)
East Asia & Pacific (IDA & IBRD countries)
Ecuador
Egypt, Arab Rep.
El Salvador
Equatorial Guinea
Eritrea
Ethiopia
Fragile and conflict affected situations
Gabon
Gambia, The
Ghana
Grenada
Guatemala
Guinea
Guinea-Bissau
Guyana
Haiti
Heavily indebted poor countries (HIPC)
Honduras
IBRD only
IDA & IBRD total
IDA blend
IDA only
IDA total
India
Indonesia
Iran, Islamic Rep.
Iraq
Jamaica
Jordan
Kenya
Korea, Dem. People’s Rep.
Lao PDR
Late-demographic dividend
Latin America & Caribbean
Latin America & Caribbean (excluding high income)
Latin America & the Caribbean (IDA & IBRD countries)
Least developed countries: UN classification
Lebanon
Lesotho
Liberia
Libya
Low & middle income
Low income
Lower middle income
Madagascar
Malawi
Mali
Mauritania
Mexico
Middle East & North Africa
Middle East & North Africa (excluding high income)
Middle East & North Africa (IDA & IBRD countries)
Middle income
Mongolia
Morocco
Mozambique
Myanmar
Namibia
Nepal
Nicaragua
Niger
Nigeria
Oman
Pakistan
Panama
Paraguay
Peru
Philippines
Pre-demographic dividend
Rwanda
Sao Tome and Principe
Saudi Arabia
Senegal
Sierra Leone
Somalia
South Africa
South Asia
South Asia (IDA & IBRD)
South Sudan
Sri Lanka
St. Lucia
Sub-Saharan Africa
Sub-Saharan Africa (excluding high income)
Sub-Saharan Africa (IDA & IBRD countries)
Sudan
Suriname
Swaziland
Syrian Arab Republic
Tanzania
Thailand
Togo
Trinidad and Tobago
Tunisia
Turkey
Uganda
Upper middle income
Venezuela, RB
Vietnam
Yemen, Rep.
Zambia
Zimbabwe
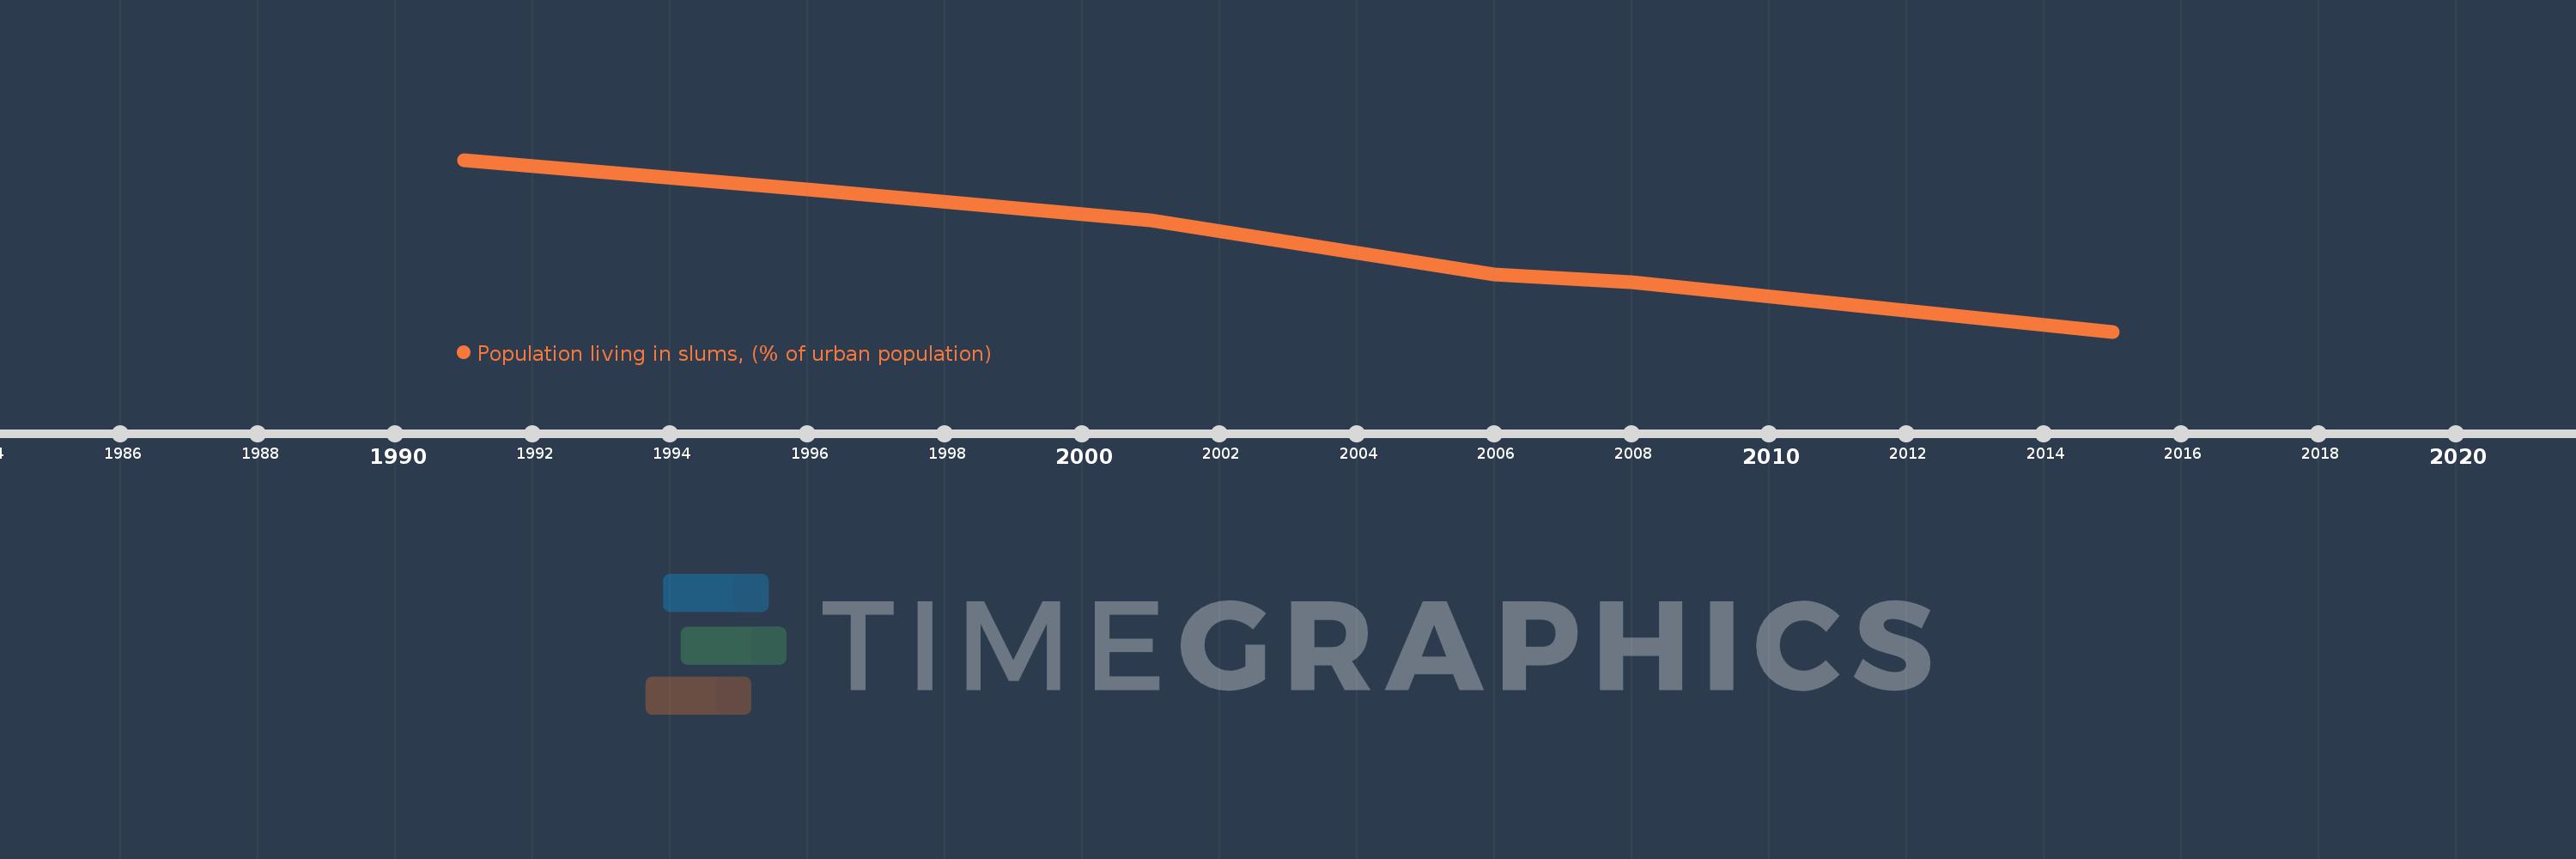
Timeline:
This timeline shows a graph from
1991
to
2015
of Latin America & Caribbean . No data until
1990
. Number of actual observations by date:
6
.
Source name:
World Development Indicators
Source organization:
UN HABITAT, retrieved from the United Nation's Millennium Development Goals database. Data are available at: Http://mdgs.un.org
Categories, topics:
Poverty, Urban Development, Environment
Last updated:
apr 23, 2017
Indicators value changes by year
Meaning:
28.19
Minimum:
20.456
jan 1, 2015
Maximum:
35.451
jan 1, 1991
At the date of observation
Value
Absolute change
Change from the previous value
jan 1, 1991
35.451
+35.451
0.0%
jan 1, 1996
32.851
-2.6
-7.33%
jan 1, 2001
30.202
-2.649
-8.06%
jan 1, 2006
25.422
-4.78
-15.83%
jan 1, 2008
24.761
-0.661
-2.6%
jan 1, 2015
20.456
-4.305
-17.39%
Ranking of countries by current statistics by years
About & Feedback
Terms
Privacy
FAQ
Support 24/7
Cabinet
Get premium
Donate
The service accepts bank transfer (ACH, Wire) or cards (Visa, MasterCard, etc). Processed by Stripe.
Secured with SSL