33
/
AIzaSyB4mHJ5NPEv-XzF7P6NDYXjlkCWaeKw5bc
November 30, 2025
46954
Lower middle income
LMC
false
2
1
Container port traffic (TEU: 20 foot equivalent units)
2015,2014,2013,2012,2011,2010,2009,2008,2007,2006,2005,2004,2003,2002,2001
Create a timeline
Public Timelines
For education
For educational institutions
For teachers
For students
Cabinet
For educational institutions
For teachers
For students
Open cabinet
FAQ
Close
Create a timeline
Public timelines
FAQ
About & Feedback
Terms
Privacy
FAQ
Support 24/7
Cabinet
Get premium
Donate
Download
Global statistics library
→
Lower middle income
→
Container port traffic (TEU: 20 foot equivalent units)
This statistics in other country:
Albania
Algeria
Angola
Antigua and Barbuda
Arab World
Argentina
Aruba
Australia
Austria
Bahamas, The
Bahrain
Bangladesh
Barbados
Belgium
Belize
Benin
Brazil
Brunei Darussalam
Bulgaria
Cambodia
Cameroon
Canada
Caribbean small states
Cayman Islands
Central Europe and the Baltics
Chile
China
Colombia
Congo, Rep.
Costa Rica
Cote d'Ivoire
Croatia
Cuba
Cyprus
Denmark
Djibouti
Dominican Republic
Early-demographic dividend
East Asia & Pacific
East Asia & Pacific (excluding high income)
East Asia & Pacific (IDA & IBRD countries)
Ecuador
Egypt, Arab Rep.
El Salvador
Estonia
Euro area
Europe & Central Asia
Europe & Central Asia (excluding high income)
Europe & Central Asia (IDA & IBRD countries)
European Union
Finland
France
French Polynesia
Gabon
Georgia
Germany
Ghana
Greece
Guam
Guatemala
High income
Honduras
Hong Kong SAR, China
IBRD only
Iceland
IDA & IBRD total
IDA blend
India
Indonesia
Iran, Islamic Rep.
Ireland
Israel
Italy
Jamaica
Japan
Jordan
Kenya
Korea, Rep.
Kuwait
Late-demographic dividend
Latin America & Caribbean
Latin America & Caribbean (excluding high income)
Latin America & the Caribbean (IDA & IBRD countries)
Latvia
Lebanon
Libya
Lithuania
Low & middle income
Lower middle income
Madagascar
Malaysia
Maldives
Malta
Mauritania
Mauritius
Mexico
Middle East & North Africa
Middle East & North Africa (excluding high income)
Middle East & North Africa (IDA & IBRD countries)
Middle income
Morocco
Mozambique
Myanmar
Namibia
Netherlands
New Caledonia
New Zealand
Nicaragua
Nigeria
North America
Norway
OECD members
Oman
Pakistan
Panama
Papua New Guinea
Paraguay
Peru
Philippines
Poland
Portugal
Post-demographic dividend
Puerto Rico
Qatar
Romania
Russian Federation
Saudi Arabia
Senegal
Singapore
Slovenia
South Africa
South Asia
South Asia (IDA & IBRD)
Spain
Sri Lanka
St. Lucia
St. Vincent and the Grenadines
Sudan
Sweden
Switzerland
Syrian Arab Republic
Tanzania
Thailand
Trinidad and Tobago
Tunisia
Turkey
Ukraine
United Arab Emirates
United Kingdom
United States
Upper middle income
Uruguay
Venezuela, RB
Vietnam
World
Yemen, Rep.
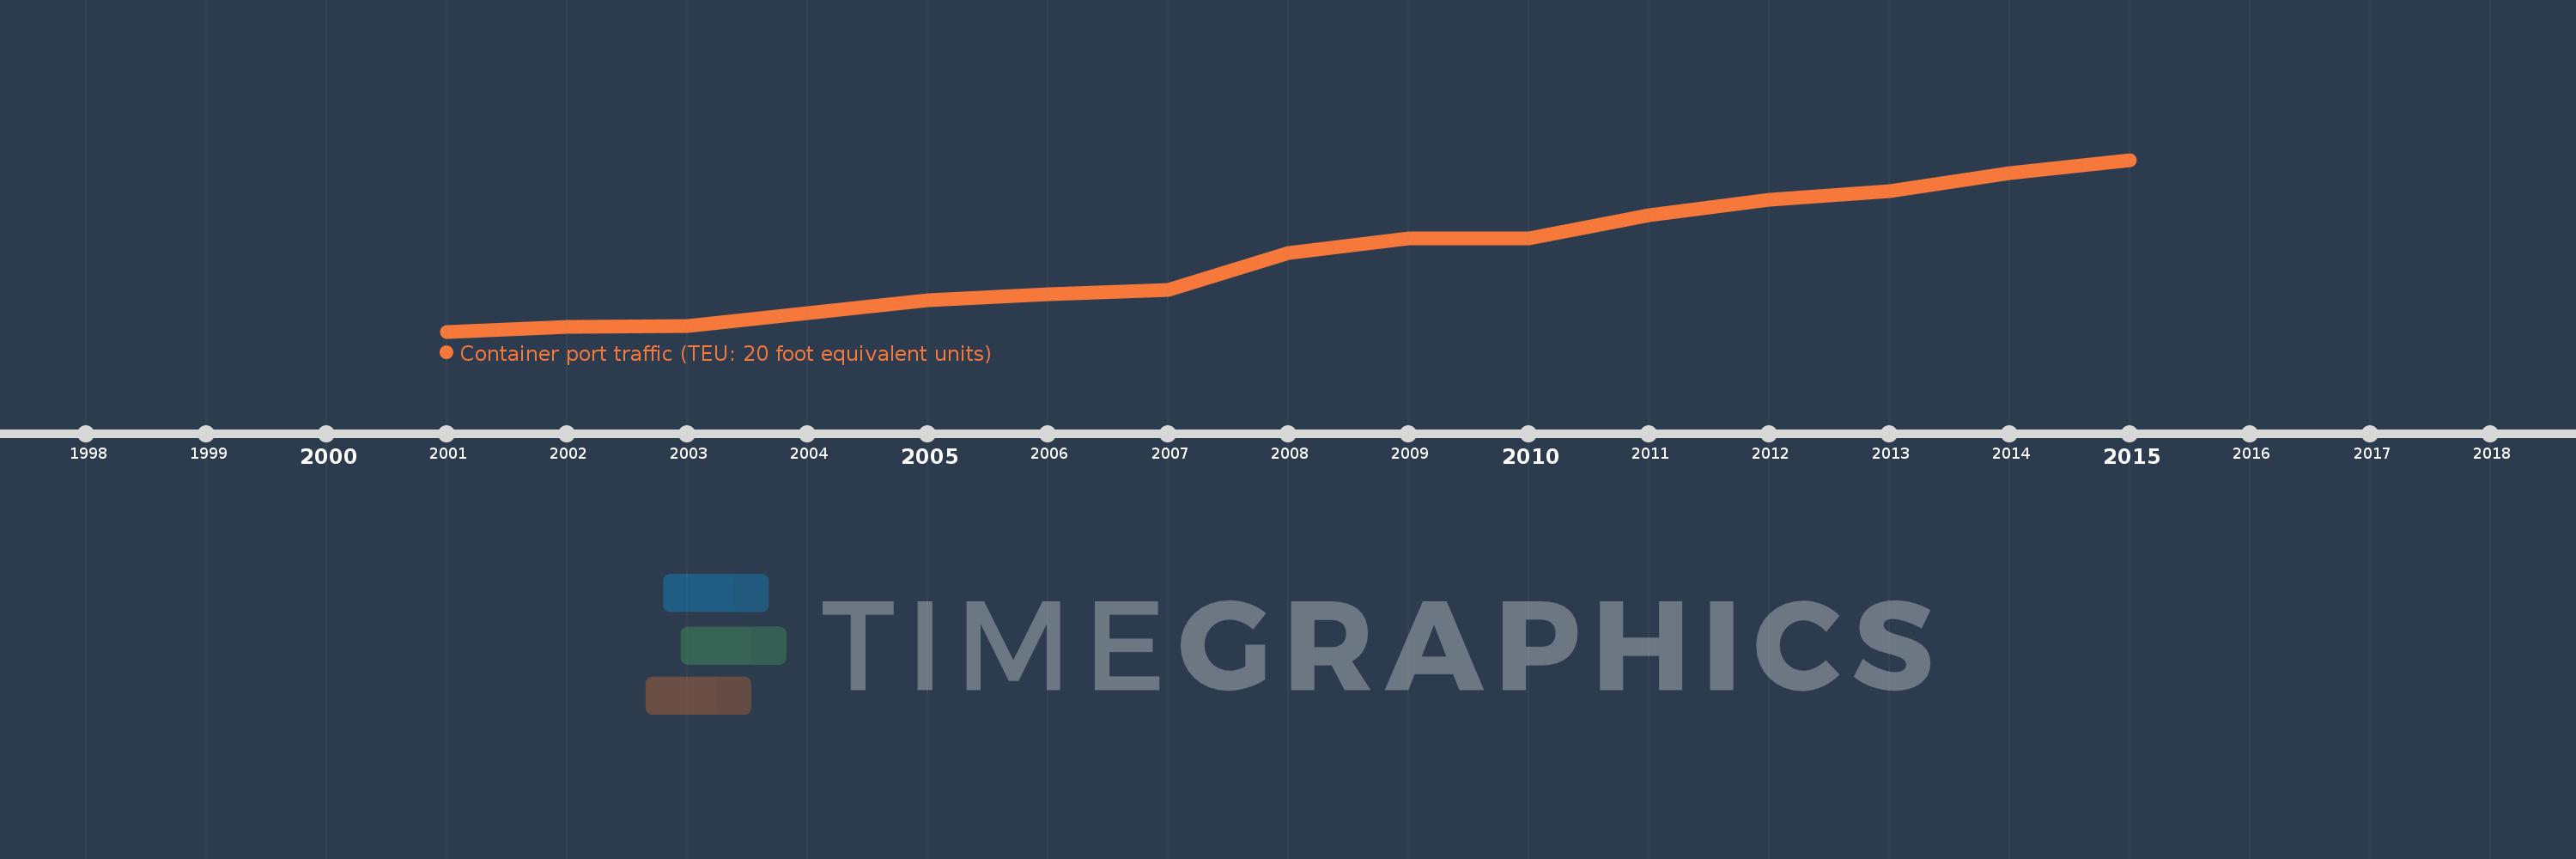
Timeline:
This timeline shows a graph from
2001
to
2015
of Lower middle income. No data until
2000
. Number of actual observations by date:
15
.
Source name:
World Development Indicators
Source organization:
Containerisation International, Containerisation International Yearbook.
Categories, topics:
Infrastructure
Last updated:
apr 23, 2017
Indicators value changes by year
Meaning:
40.63 mln
Minimum:
16.184 mln
jan 1, 2001
Maximum:
72.25 mln
jan 1, 2015
At the date of observation
Value
Absolute change
Change from the previous value
jan 1, 2001
16.184 mln
+16.184 mln
0.0%
jan 1, 2002
17.845 mln
+1.661 mln
10.26%
jan 1, 2003
17.883 mln
+37.858K
0.21%
jan 1, 2004
22.321 mln
+4.438 mln
24.82%
jan 1, 2005
26.339 mln
+4.018 mln
18.0%
jan 1, 2006
28.257 mln
+1.917 mln
7.28%
jan 1, 2007
29.794 mln
+1.537 mln
5.44%
jan 1, 2008
41.839 mln
+12.045 mln
40.43%
jan 1, 2009
46.542 mln
+4.703 mln
11.24%
jan 1, 2010
46.739 mln
+196.085K
0.42%
jan 1, 2011
54.219 mln
+7.481 mln
16.01%
jan 1, 2012
59.312 mln
+5.092 mln
9.39%
jan 1, 2013
62.085 mln
+2.773 mln
4.67%
jan 1, 2014
67.842 mln
+5.757 mln
9.27%
jan 1, 2015
72.25 mln
+4.408 mln
6.5%
Ranking of countries by current statistics by years
About & Feedback
Terms
Privacy
FAQ
Support 24/7
Cabinet
Get premium
Donate
The service accepts bank transfer (ACH, Wire) or cards (Visa, MasterCard, etc). Processed by Stripe.
Secured with SSL