33
/
AIzaSyAYiBZKx7MnpbEhh9jyipgxe19OcubqV5w
August 1, 2025
31411
Europe & Central Asia (excluding high income)
ECA
false
2
1
Container port traffic (TEU: 20 foot equivalent units)
2015,2014,2013,2012,2011,2010,2009,2008,2007,2006,2005
Download
Global statistics library →Europe & Central Asia (excluding high income) →

Container port traffic (TEU: 20 foot equivalent units)

This statistics in other country:

AlbaniaAlgeriaAngolaAntigua and BarbudaArab WorldArgentinaArubaAustraliaAustriaBahamas, TheBahrainBangladeshBarbadosBelgiumBelizeBeninBrazilBrunei DarussalamBulgariaCambodiaCameroonCanadaCaribbean small statesCayman IslandsCentral Europe and the BalticsChileChinaColombiaCongo, Rep.Costa RicaCote d'IvoireCroatiaCubaCyprusDenmarkDjiboutiDominican RepublicEarly-demographic dividendEast Asia & PacificEast Asia & Pacific (excluding high income)East Asia & Pacific (IDA & IBRD countries)EcuadorEgypt, Arab Rep.El SalvadorEstoniaEuro areaEurope & Central AsiaEurope & Central Asia (excluding high income)Europe & Central Asia (IDA & IBRD countries)European UnionFinlandFranceFrench PolynesiaGabonGeorgiaGermanyGhanaGreeceGuamGuatemalaHigh incomeHondurasHong Kong SAR, ChinaIBRD onlyIcelandIDA & IBRD totalIDA blendIndiaIndonesiaIran, Islamic Rep.IrelandIsraelItalyJamaicaJapanJordanKenyaKorea, Rep.KuwaitLate-demographic dividendLatin America & Caribbean Latin America & Caribbean (excluding high income)Latin America & the Caribbean (IDA & IBRD countries)LatviaLebanonLibyaLithuaniaLow & middle incomeLower middle incomeMadagascarMalaysiaMaldivesMaltaMauritaniaMauritiusMexicoMiddle East & North AfricaMiddle East & North Africa (excluding high income)Middle East & North Africa (IDA & IBRD countries)Middle incomeMoroccoMozambiqueMyanmarNamibiaNetherlandsNew CaledoniaNew ZealandNicaraguaNigeriaNorth AmericaNorwayOECD membersOmanPakistanPanamaPapua New GuineaParaguayPeruPhilippinesPolandPortugalPost-demographic dividendPuerto RicoQatarRomaniaRussian FederationSaudi ArabiaSenegalSingaporeSloveniaSouth AfricaSouth AsiaSouth Asia (IDA & IBRD)SpainSri LankaSt. LuciaSt. Vincent and the GrenadinesSudanSwedenSwitzerlandSyrian Arab RepublicTanzaniaThailandTrinidad and TobagoTunisiaTurkeyUkraineUnited Arab EmiratesUnited KingdomUnited StatesUpper middle incomeUruguayVenezuela, RBVietnamWorldYemen, Rep.

Timeline:

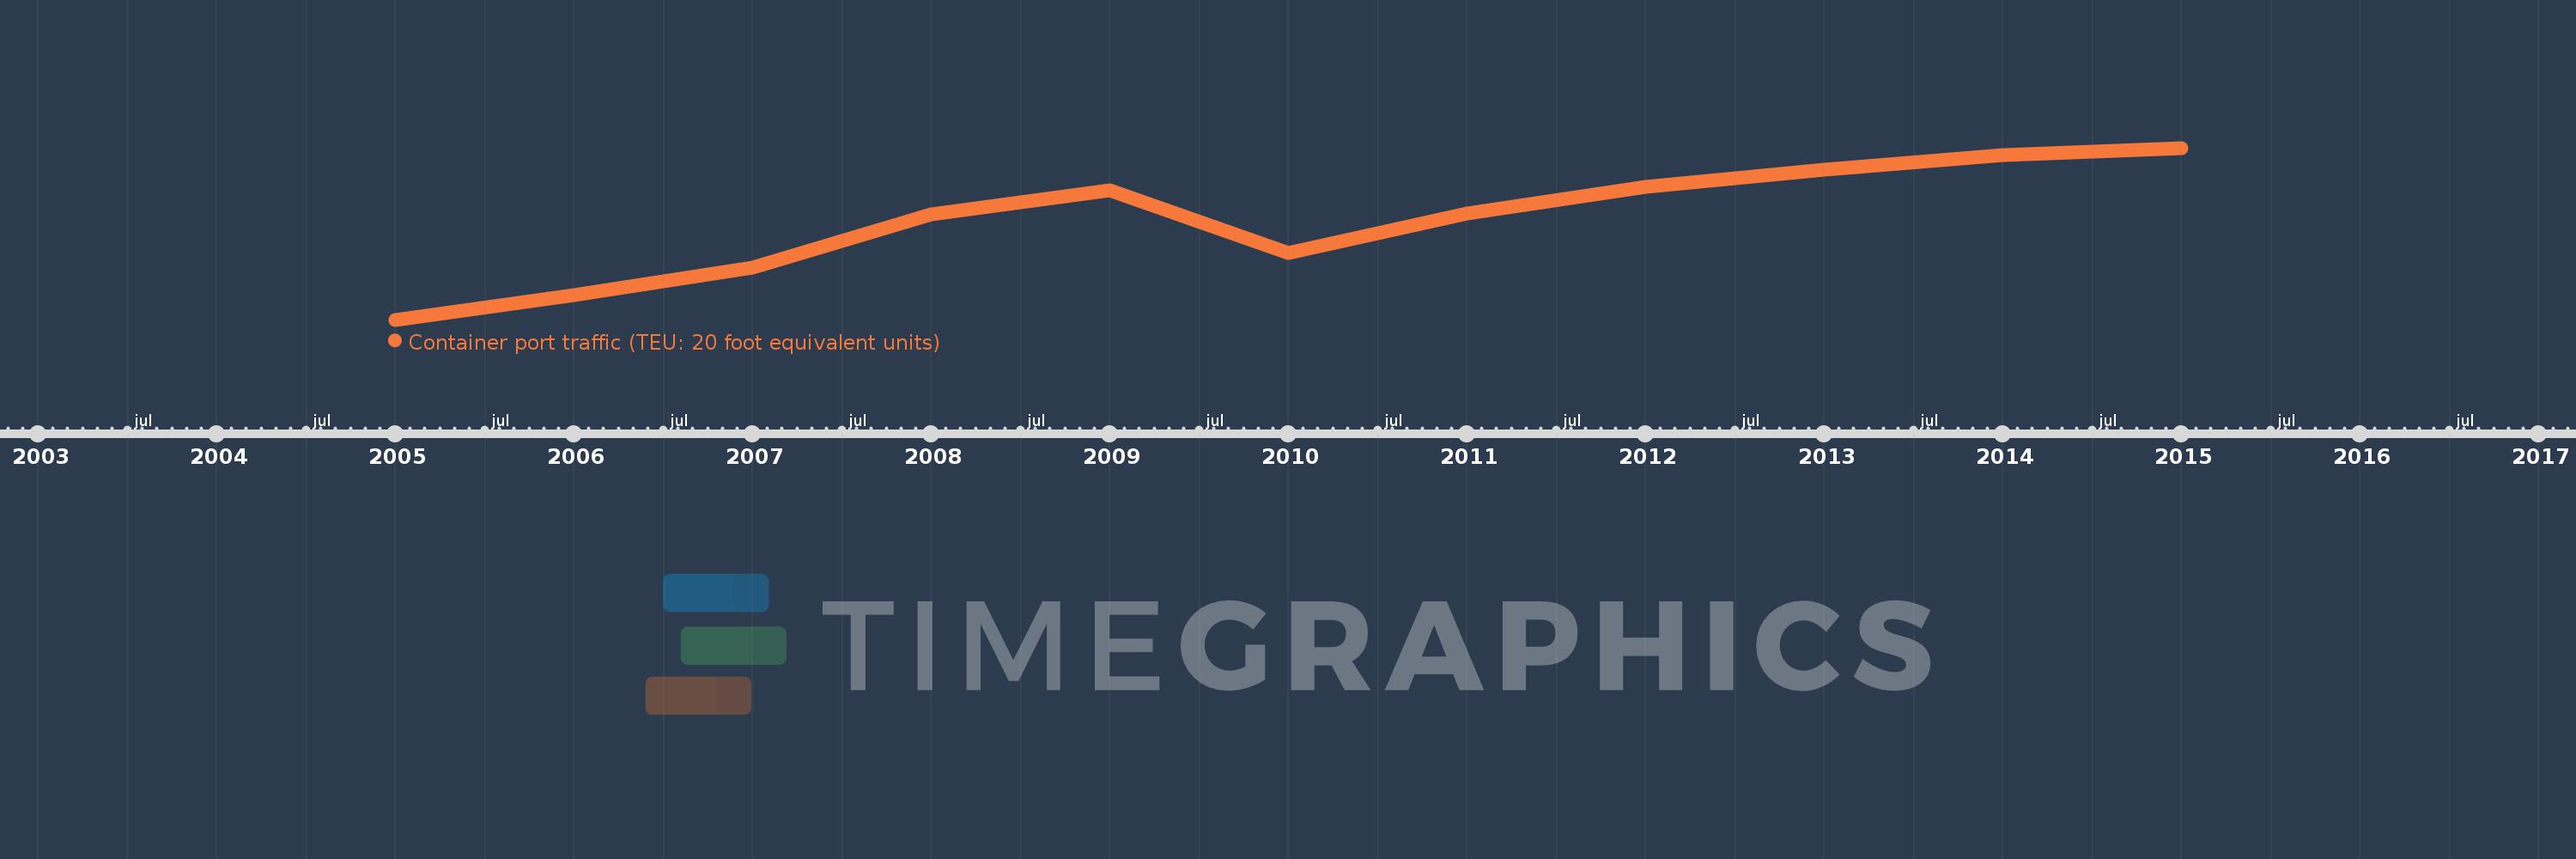
This timeline shows a graph from 2005 to 2015 of Europe & Central Asia (excluding high income). No data until 2004. Number of actual observations by date: 11.

Source name:

World Development Indicators

Source organization:

Containerisation International, Containerisation International Yearbook.

Categories, topics:

Infrastructure

Last updated:

apr 23, 2017

Indicators value changes by year

Meaning:
10.138 mln
Minimum:
5.101 mln
jan 1, 2005
Maximum:
13.725 mln
jan 1, 2015
At the date of observation
Value
Absolute change
Change from the previous value
jan 1, 2005
5.101 mln
+5.101 mln
0.0%
jan 1, 2006
6.329 mln
+1.228 mln
24.07%
jan 1, 2007
7.716 mln
+1.387 mln
21.92%
jan 1, 2008
10.391 mln
+2.675 mln
34.67%
jan 1, 2009
11.598 mln
+1.207 mln
11.62%
jan 1, 2010
8.447 mln
-3.151 mln
-27.17%
jan 1, 2011
10.446 mln
+1.999 mln
23.66%
jan 1, 2012
11.786 mln
+1.34 mln
12.83%
jan 1, 2013
12.617 mln
+831.539K
7.06%
jan 1, 2014
13.36 mln
+742.12K
5.88%
jan 1, 2015
13.725 mln
+365.324K
2.73%

Ranking of countries by current statistics by years