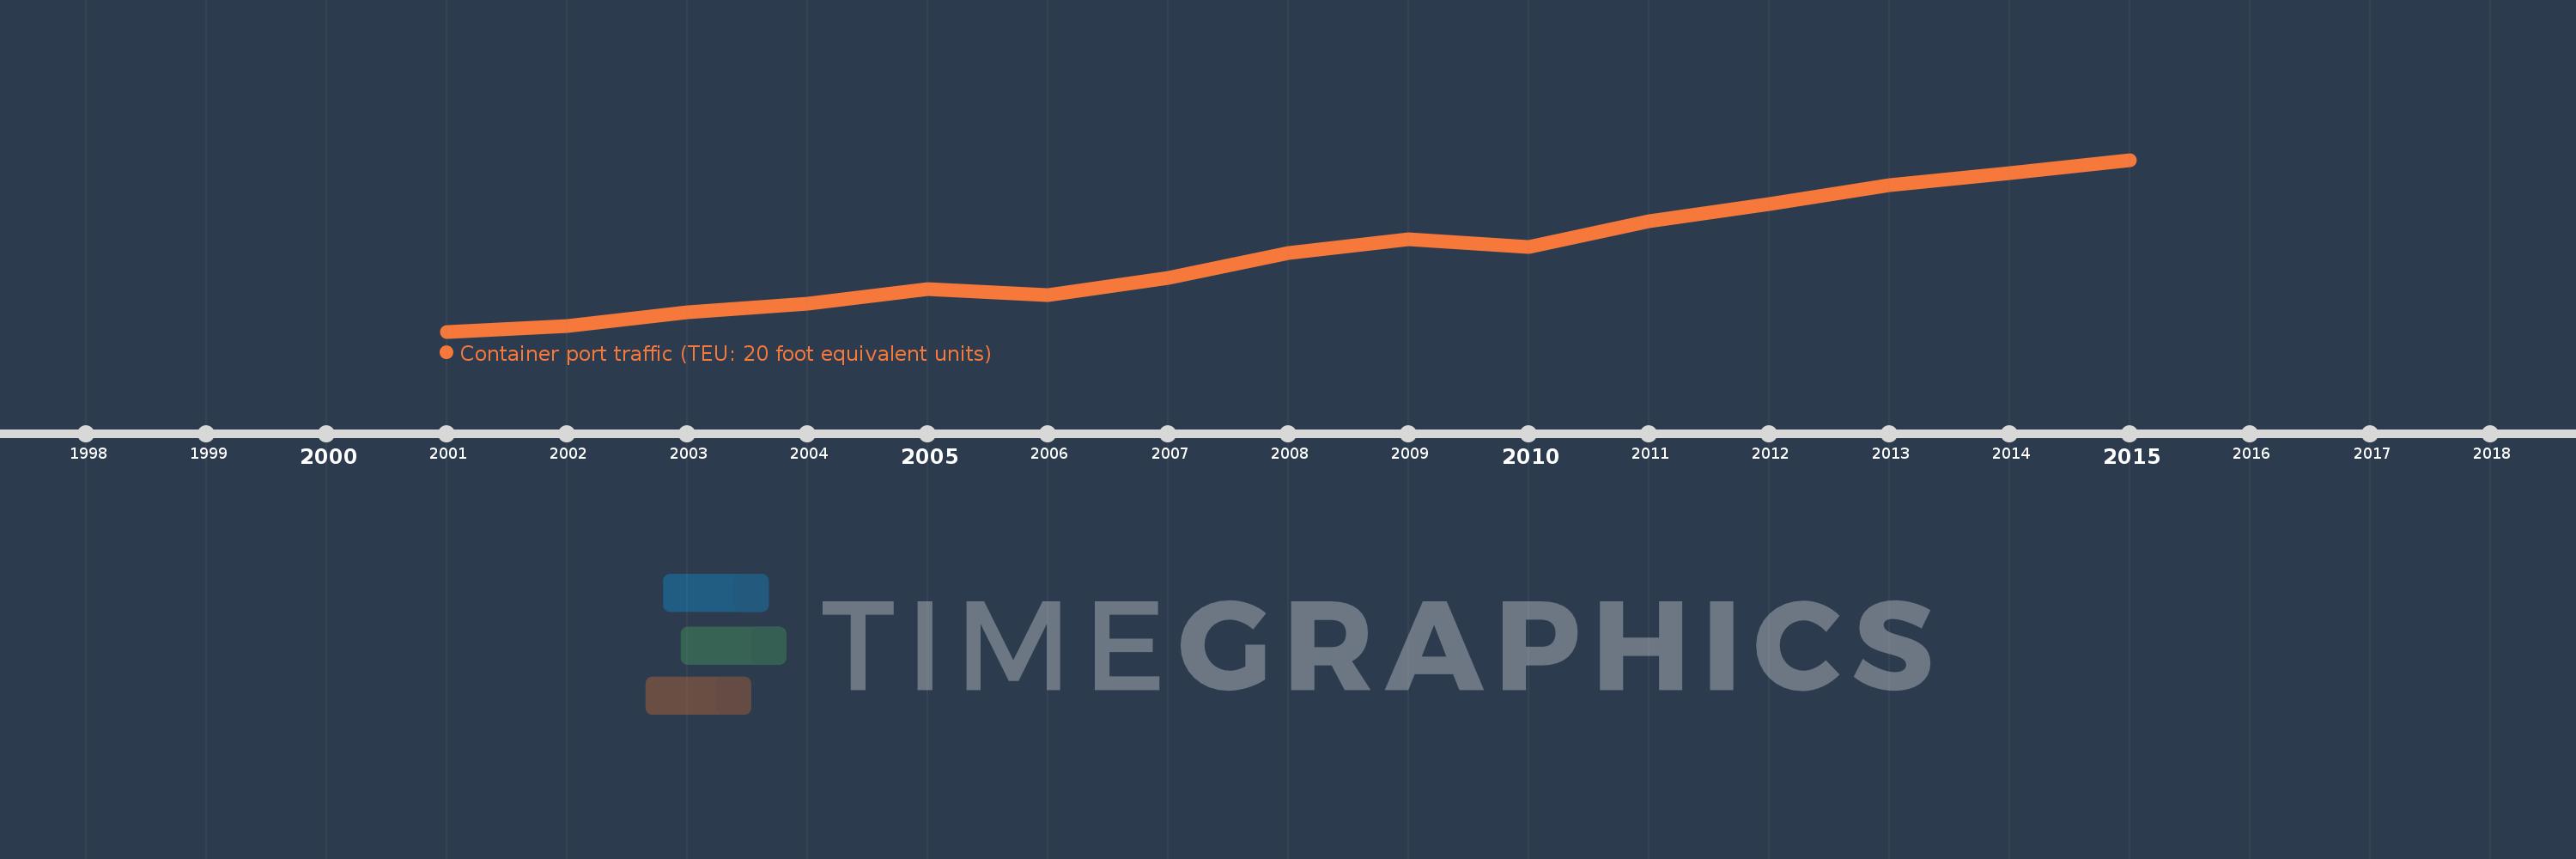
This timeline shows a graph from 2001 to 2015 of East Asia & Pacific (IDA & IBRD countries). No data until 2000. Number of actual observations by date: 15.
Source name:
World Development Indicators
Source organization:
Containerisation International, Containerisation International Yearbook.
Categories, topics:
Infrastructure
Last updated:
apr 23, 2017
Indicators value changes by year
Meaning:
139.473 mln
Minimum:
56.84 mln
jan 1, 2001
Maximum:
240.855 mln
jan 1, 2015
At the date of observation
Value
Absolute change
Change from the previous value
jan 1, 2001
56.84 mln
+56.84 mln
0.0%
jan 1, 2002
62.621 mln
+5.781 mln
10.17%
jan 1, 2003
77.905 mln
+15.283 mln
24.41%
jan 1, 2004
86.892 mln
+8.987 mln
11.54%
jan 1, 2005
102.402 mln
+15.511 mln
17.85%
jan 1, 2006
96.232 mln
-6.17 mln
-6.03%
jan 1, 2007
114.796 mln
+18.564 mln
19.29%
jan 1, 2008
140.64 mln
+25.844 mln
22.51%
jan 1, 2009
155.725 mln
+15.085 mln
10.73%
jan 1, 2010
147.753 mln
-7.973 mln
-5.12%
jan 1, 2011
175.329 mln
+27.577 mln
18.66%
jan 1, 2012
193.889 mln
+18.559 mln
10.59%
jan 1, 2013
213.341 mln
+19.453 mln
10.03%
jan 1, 2014
226.873 mln
+13.532 mln
6.34%
jan 1, 2015
240.855 mln
+13.982 mln
6.16%
Ranking of countries by current statistics by years