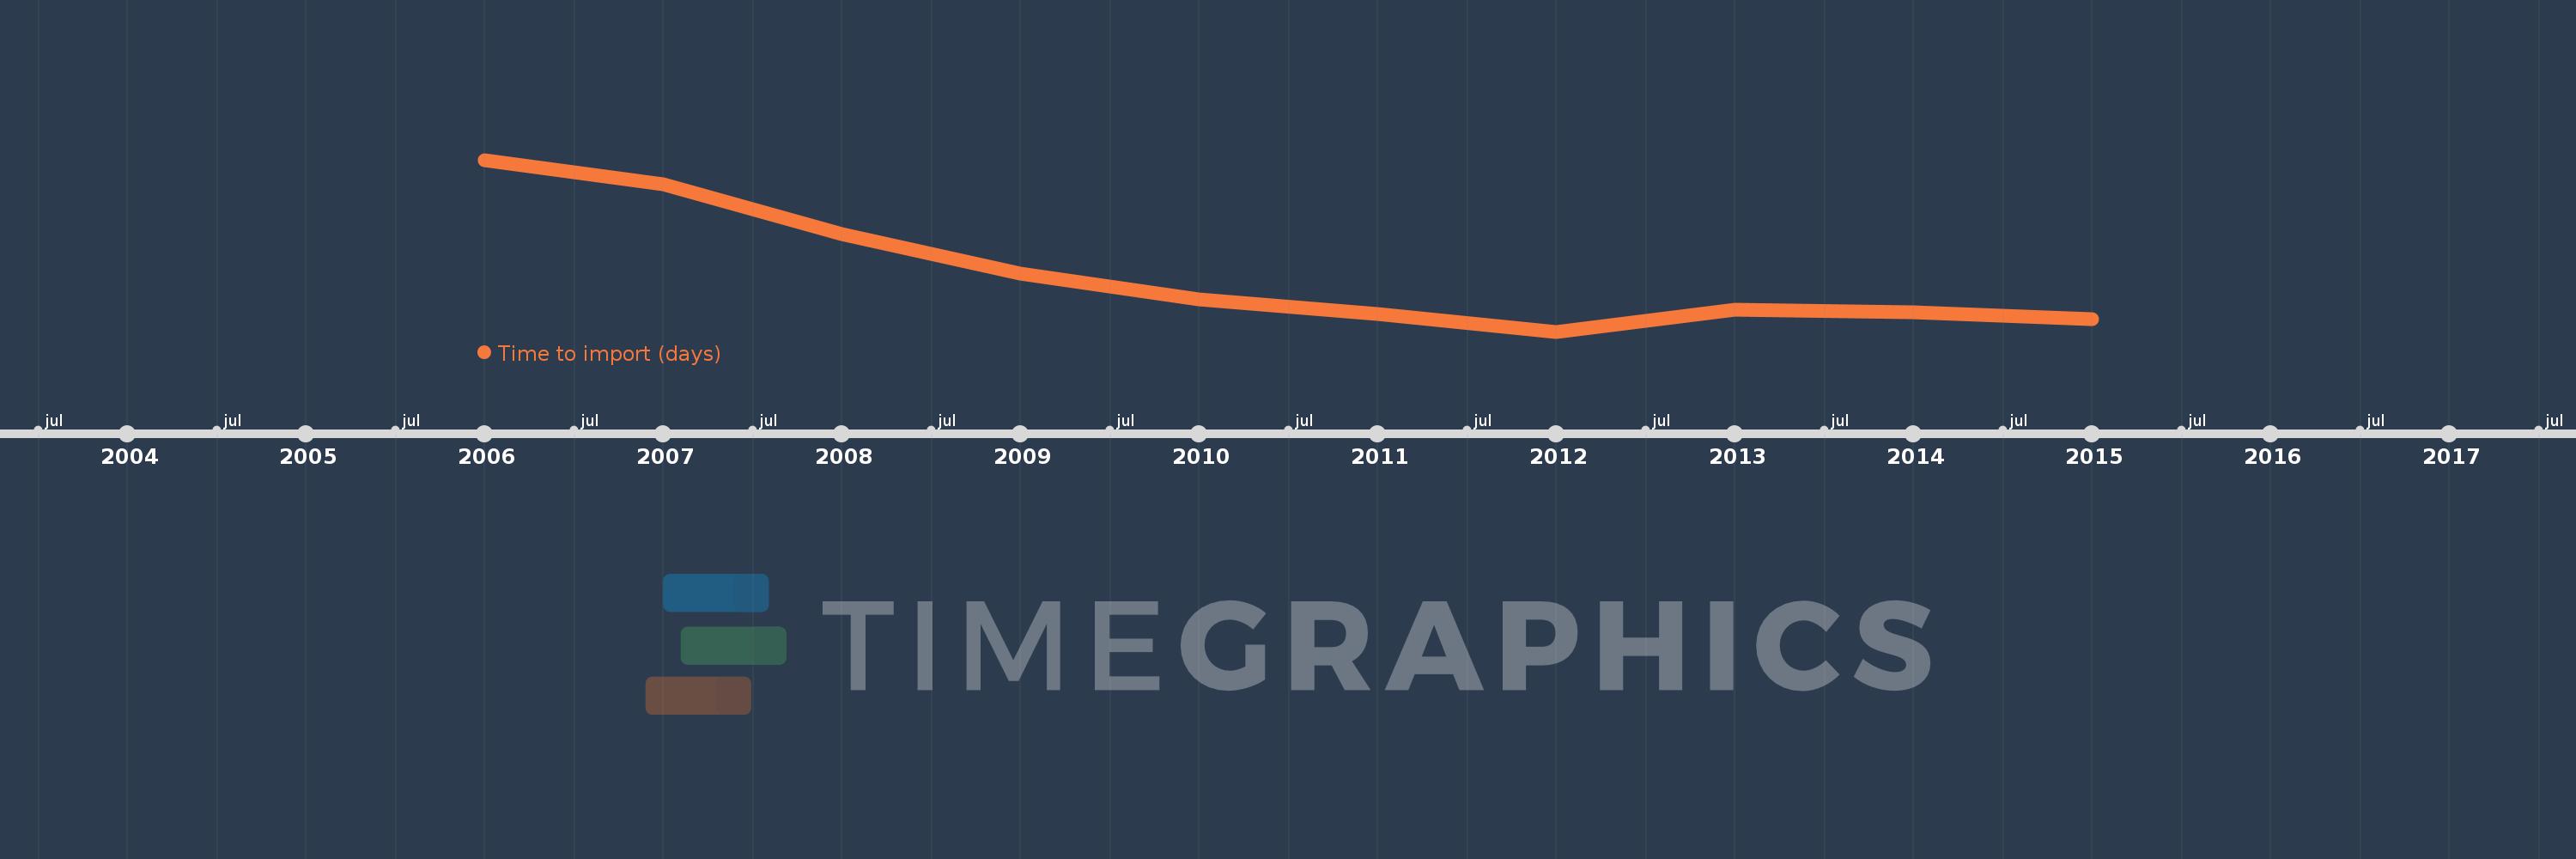
This timeline shows a graph from 2006 to 2015 of Least developed countries: UN classification. No data until 2005. Number of actual observations by date: 10.
Source name:
World Development Indicators
Source organization:
World Bank, Doing Business project (http://www.doingbusiness.org/).
Categories, topics:
Private Sector, Trade
Last updated:
apr 23, 2017
Indicators value changes by year
Meaning:
40.974
Minimum:
37.248
jan 1, 2012
Maximum:
48.305
jan 1, 2006
At the date of observation
Value
Absolute change
Change from the previous value
jan 1, 2006
48.305
+48.305
0.0%
jan 1, 2007
46.73
-1.575
-3.26%
jan 1, 2008
43.536
-3.193
-6.83%
jan 1, 2009
40.991
-2.545
-5.85%
jan 1, 2010
39.302
-1.689
-4.12%
jan 1, 2011
38.384
-0.918
-2.34%
jan 1, 2012
37.248
-1.136
-2.96%
jan 1, 2013
38.672
+1.424
3.82%
jan 1, 2014
38.513
-0.159
-0.41%
jan 1, 2015
38.057
-0.457
-1.19%
Ranking of countries by current statistics by years