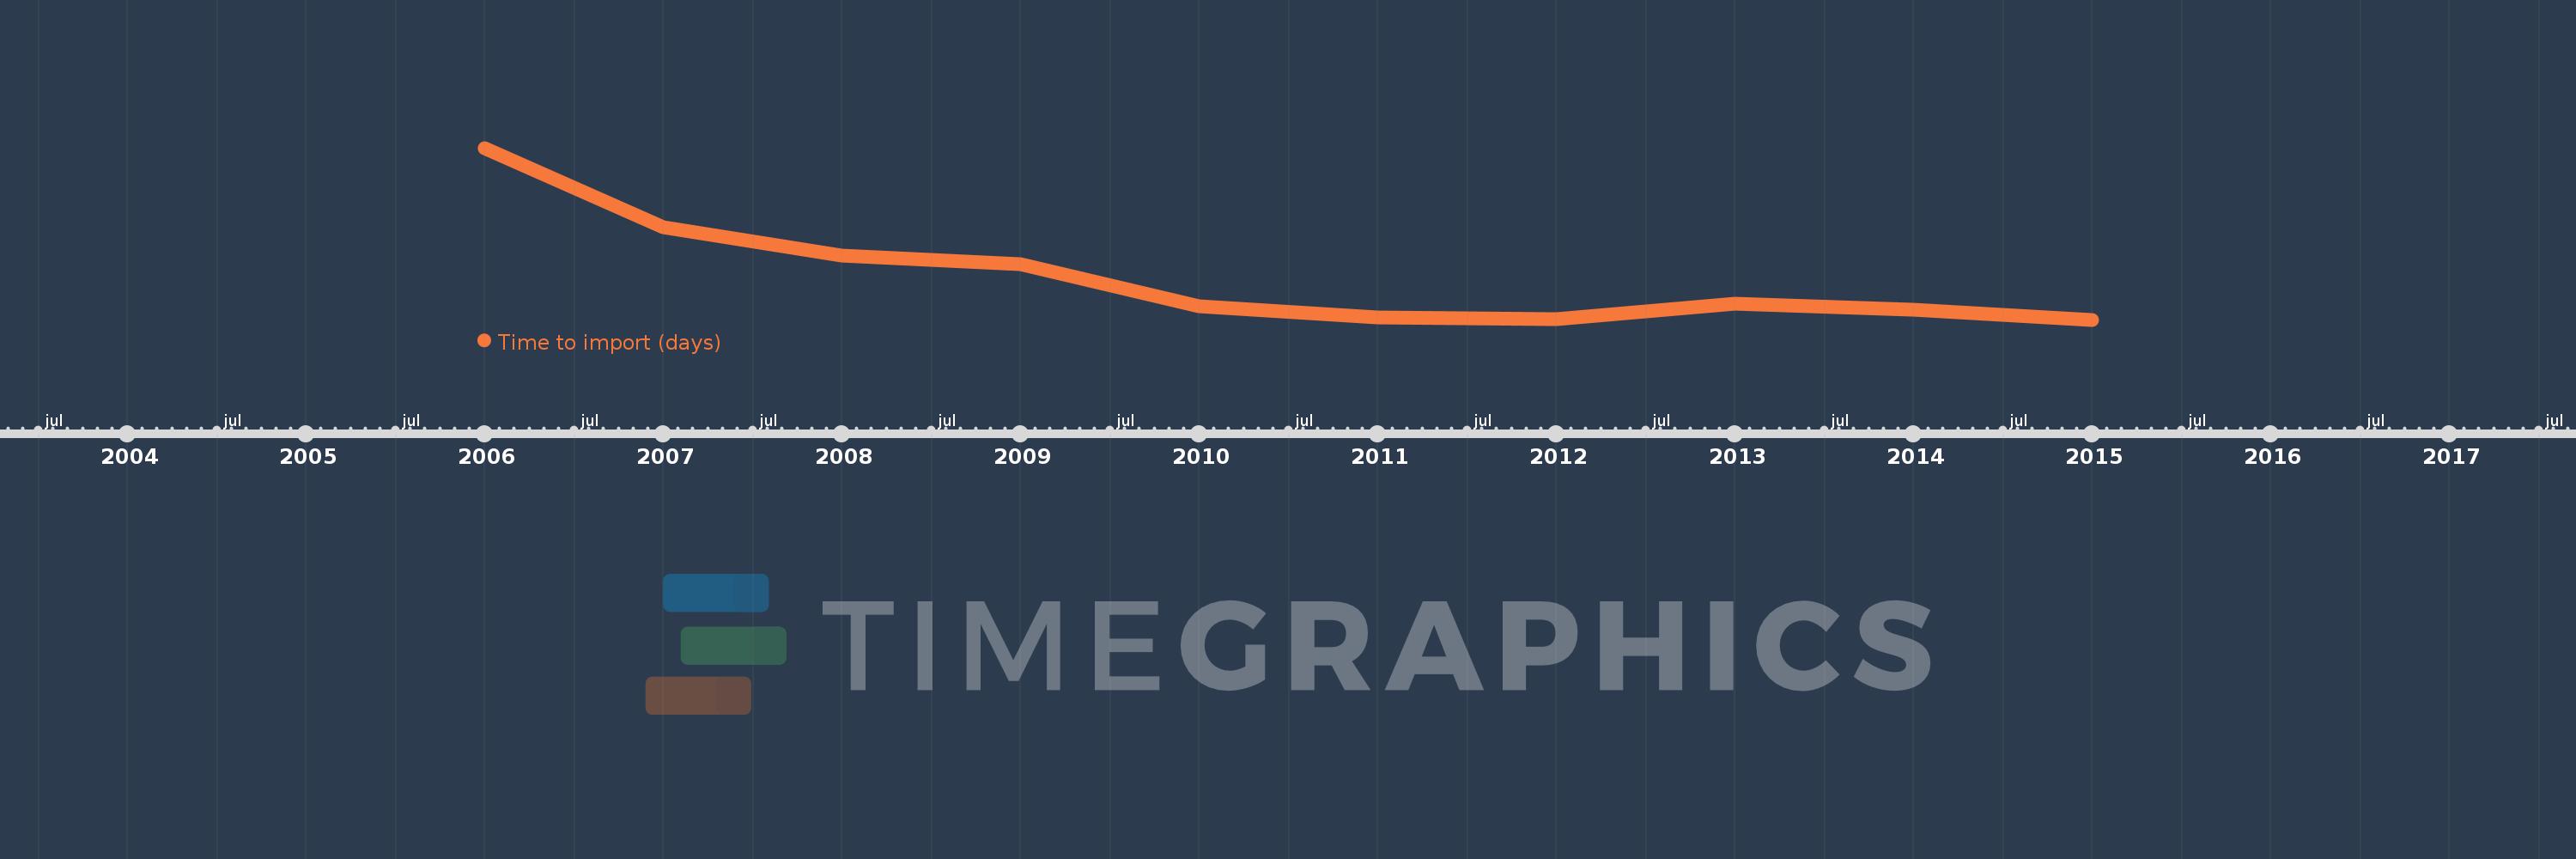
This timeline shows a graph from 2006 to 2015 of Europe & Central Asia (IDA & IBRD countries). No data until 2005. Number of actual observations by date: 10.
Source name:
World Development Indicators
Source organization:
World Bank, Doing Business project (http://www.doingbusiness.org/).
Categories, topics:
Private Sector, Trade
Last updated:
apr 23, 2017
Indicators value changes by year
Meaning:
31.4
Minimum:
28.609
jan 1, 2015
Maximum:
39.855
jan 1, 2006
At the date of observation
Value
Absolute change
Change from the previous value
jan 1, 2006
39.855
+39.855
0.0%
jan 1, 2007
34.671
-5.184
-13.01%
jan 1, 2008
32.814
-1.857
-5.36%
jan 1, 2009
32.243
-0.571
-1.74%
jan 1, 2010
29.505
-2.738
-8.49%
jan 1, 2011
28.777
-0.727
-2.46%
jan 1, 2012
28.641
-0.136
-0.47%
jan 1, 2013
29.641
+1.0
3.49%
jan 1, 2014
29.245
-0.395
-1.33%
jan 1, 2015
28.609
-0.636
-2.18%
Ranking of countries by current statistics by years