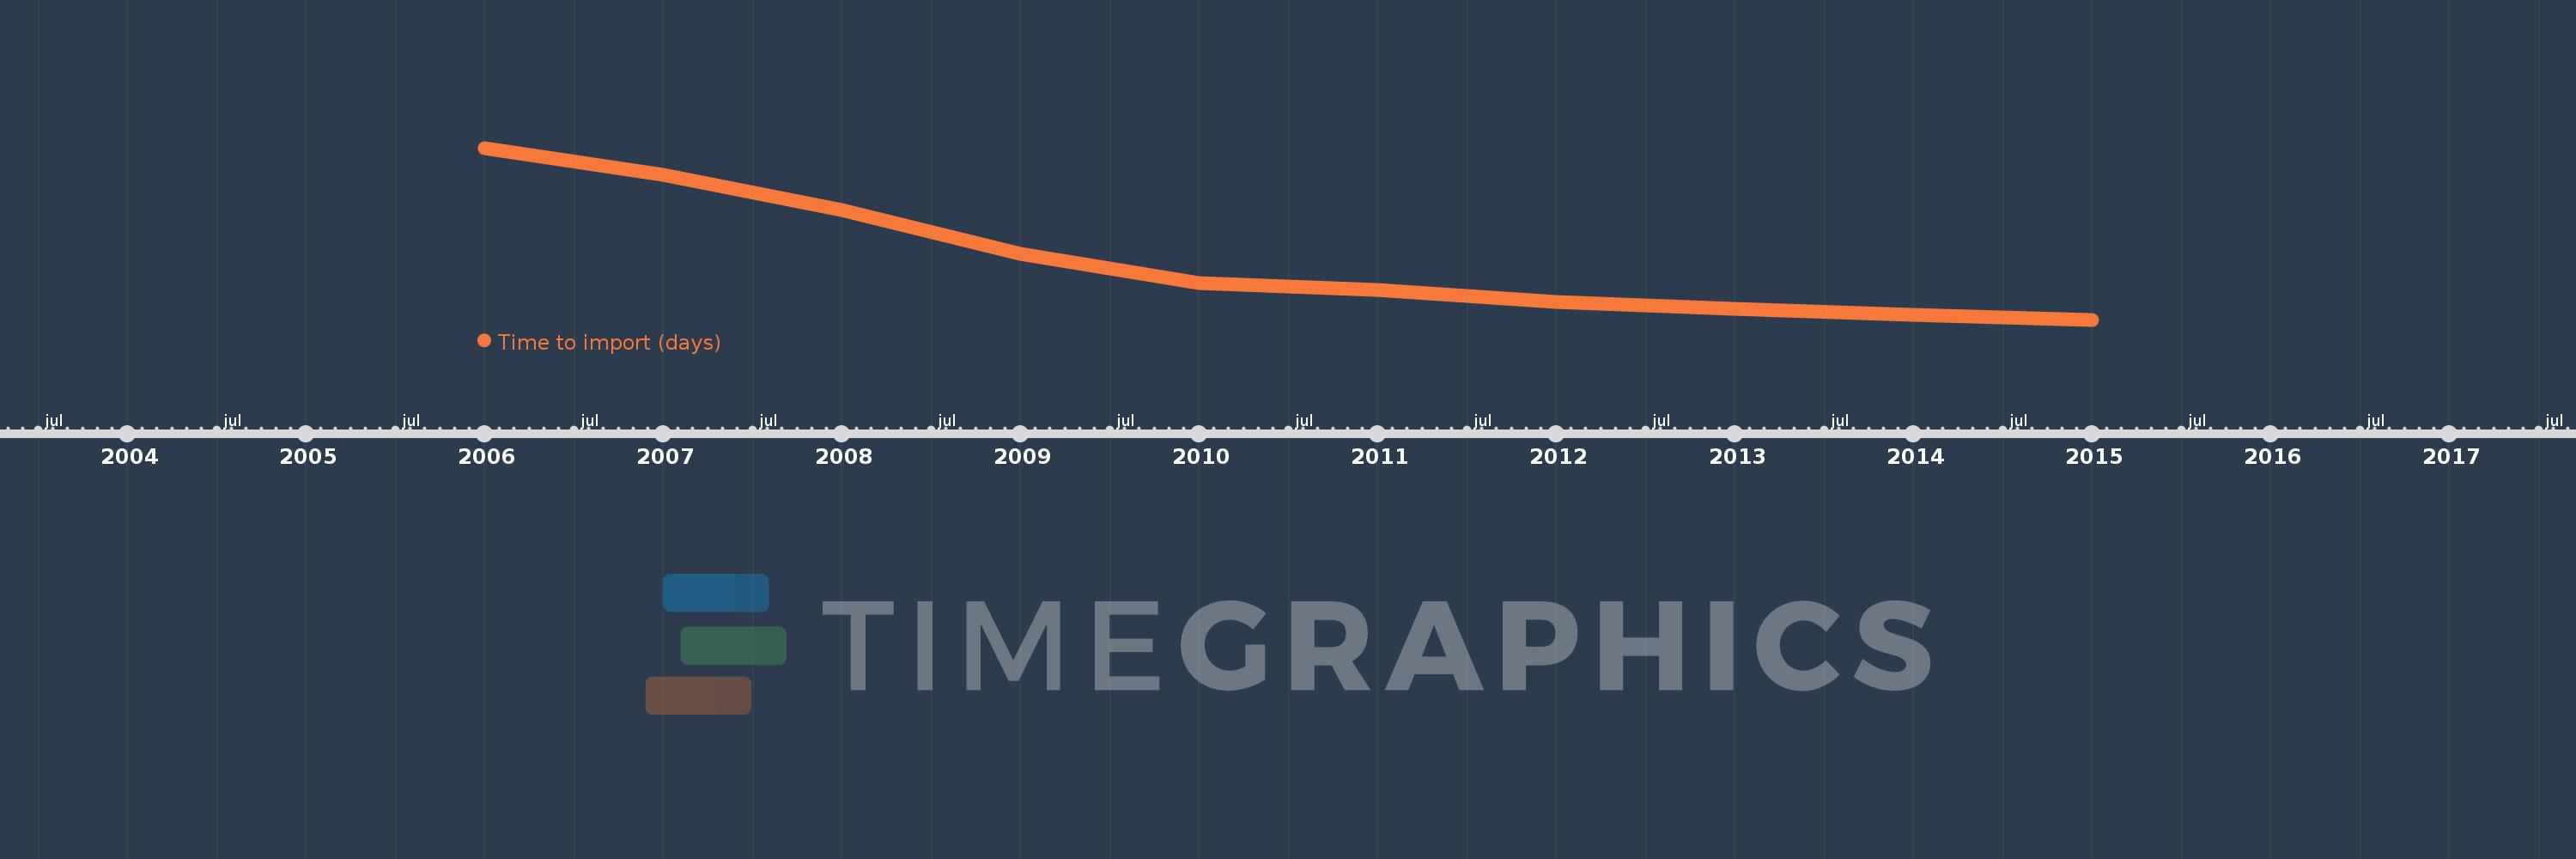
This timeline shows a graph from 2006 to 2015 of Heavily indebted poor countries (HIPC). No data until 2005. Number of actual observations by date: 10.
Source name:
World Development Indicators
Source organization:
World Bank, Doing Business project (http://www.doingbusiness.org/).
Categories, topics:
Private Sector, Trade
Last updated:
apr 23, 2017
Indicators value changes by year
Meaning:
41.824
Minimum:
37.395
jan 1, 2015
Maximum:
50.243
jan 1, 2006
At the date of observation
Value
Absolute change
Change from the previous value
jan 1, 2006
50.243
+50.243
0.0%
jan 1, 2007
48.263
-1.98
-3.94%
jan 1, 2008
45.579
-2.684
-5.56%
jan 1, 2009
42.342
-3.237
-7.1%
jan 1, 2010
40.132
-2.211
-5.22%
jan 1, 2011
39.632
-0.5
-1.25%
jan 1, 2012
38.711
-0.921
-2.32%
jan 1, 2013
38.211
-0.5
-1.29%
jan 1, 2014
37.737
-0.474
-1.24%
jan 1, 2015
37.395
-0.342
-0.91%
Ranking of countries by current statistics by years