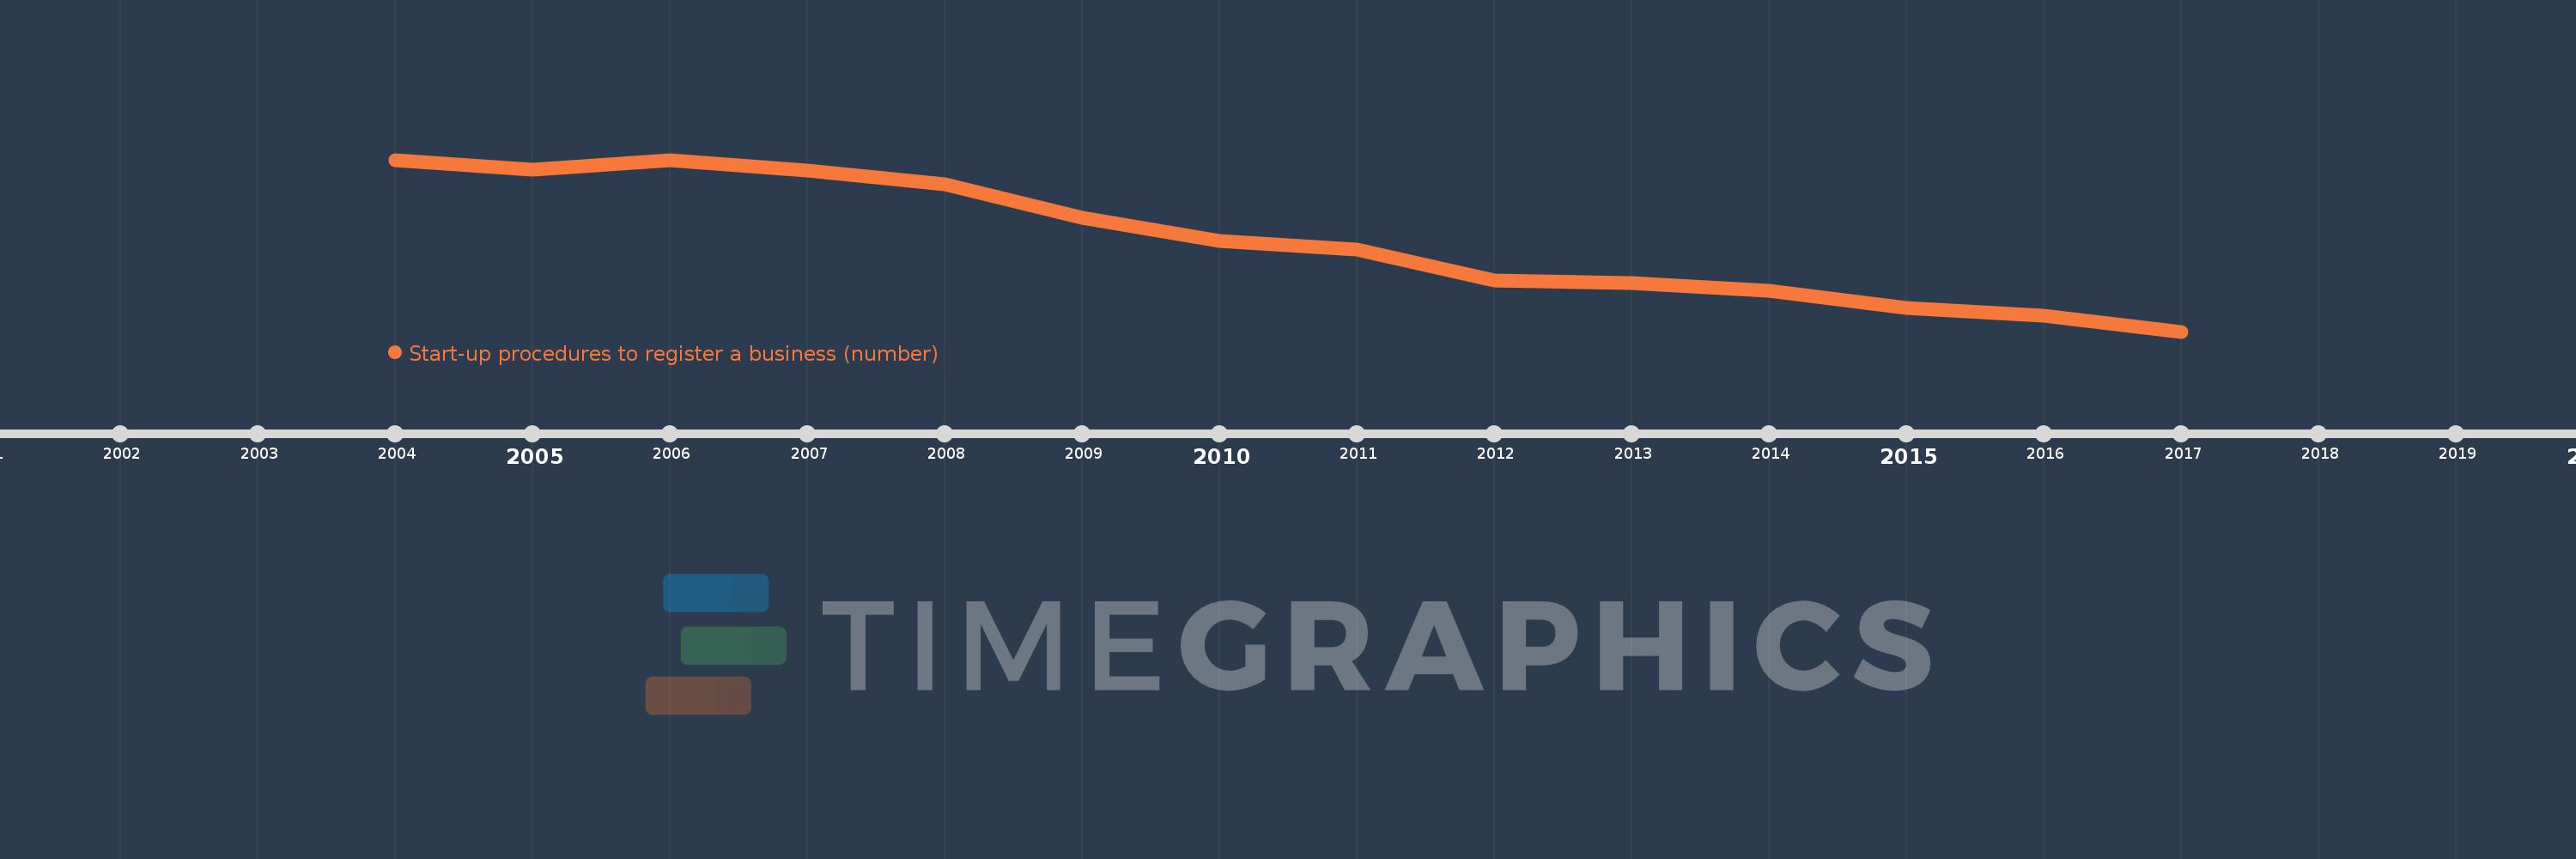
This timeline shows a graph from 2004 to 2017 of Least developed countries: UN classification. No data until 2003. Number of actual observations by date: 14.
Source name:
World Development Indicators
Source organization:
World Bank, Doing Business project (http://www.doingbusiness.org/).
Categories, topics:
Private Sector
Last updated:
apr 23, 2017
Indicators value changes by year
Meaning:
9.381
Minimum:
7.702
jan 1, 2017
Maximum:
10.86
jan 1, 2006
At the date of observation
Value
Absolute change
Change from the previous value
jan 1, 2004
10.848
+10.848
0.0%
jan 1, 2005
10.684
-0.164
-1.51%
jan 1, 2006
10.86
+0.176
1.65%
jan 1, 2007
10.659
-0.201
-1.85%
jan 1, 2008
10.409
-0.25
-2.35%
jan 1, 2009
9.795
-0.614
-5.9%
jan 1, 2010
9.364
-0.432
-4.41%
jan 1, 2011
9.205
-0.159
-1.7%
jan 1, 2012
8.636
-0.568
-6.17%
jan 1, 2013
8.587
-0.049
-0.57%
jan 1, 2014
8.457
-0.13
-1.52%
jan 1, 2015
8.13
-0.326
-3.86%
jan 1, 2016
8.0
-0.13
-1.6%
jan 1, 2017
7.702
-0.298
-3.72%
Ranking of countries by current statistics by years