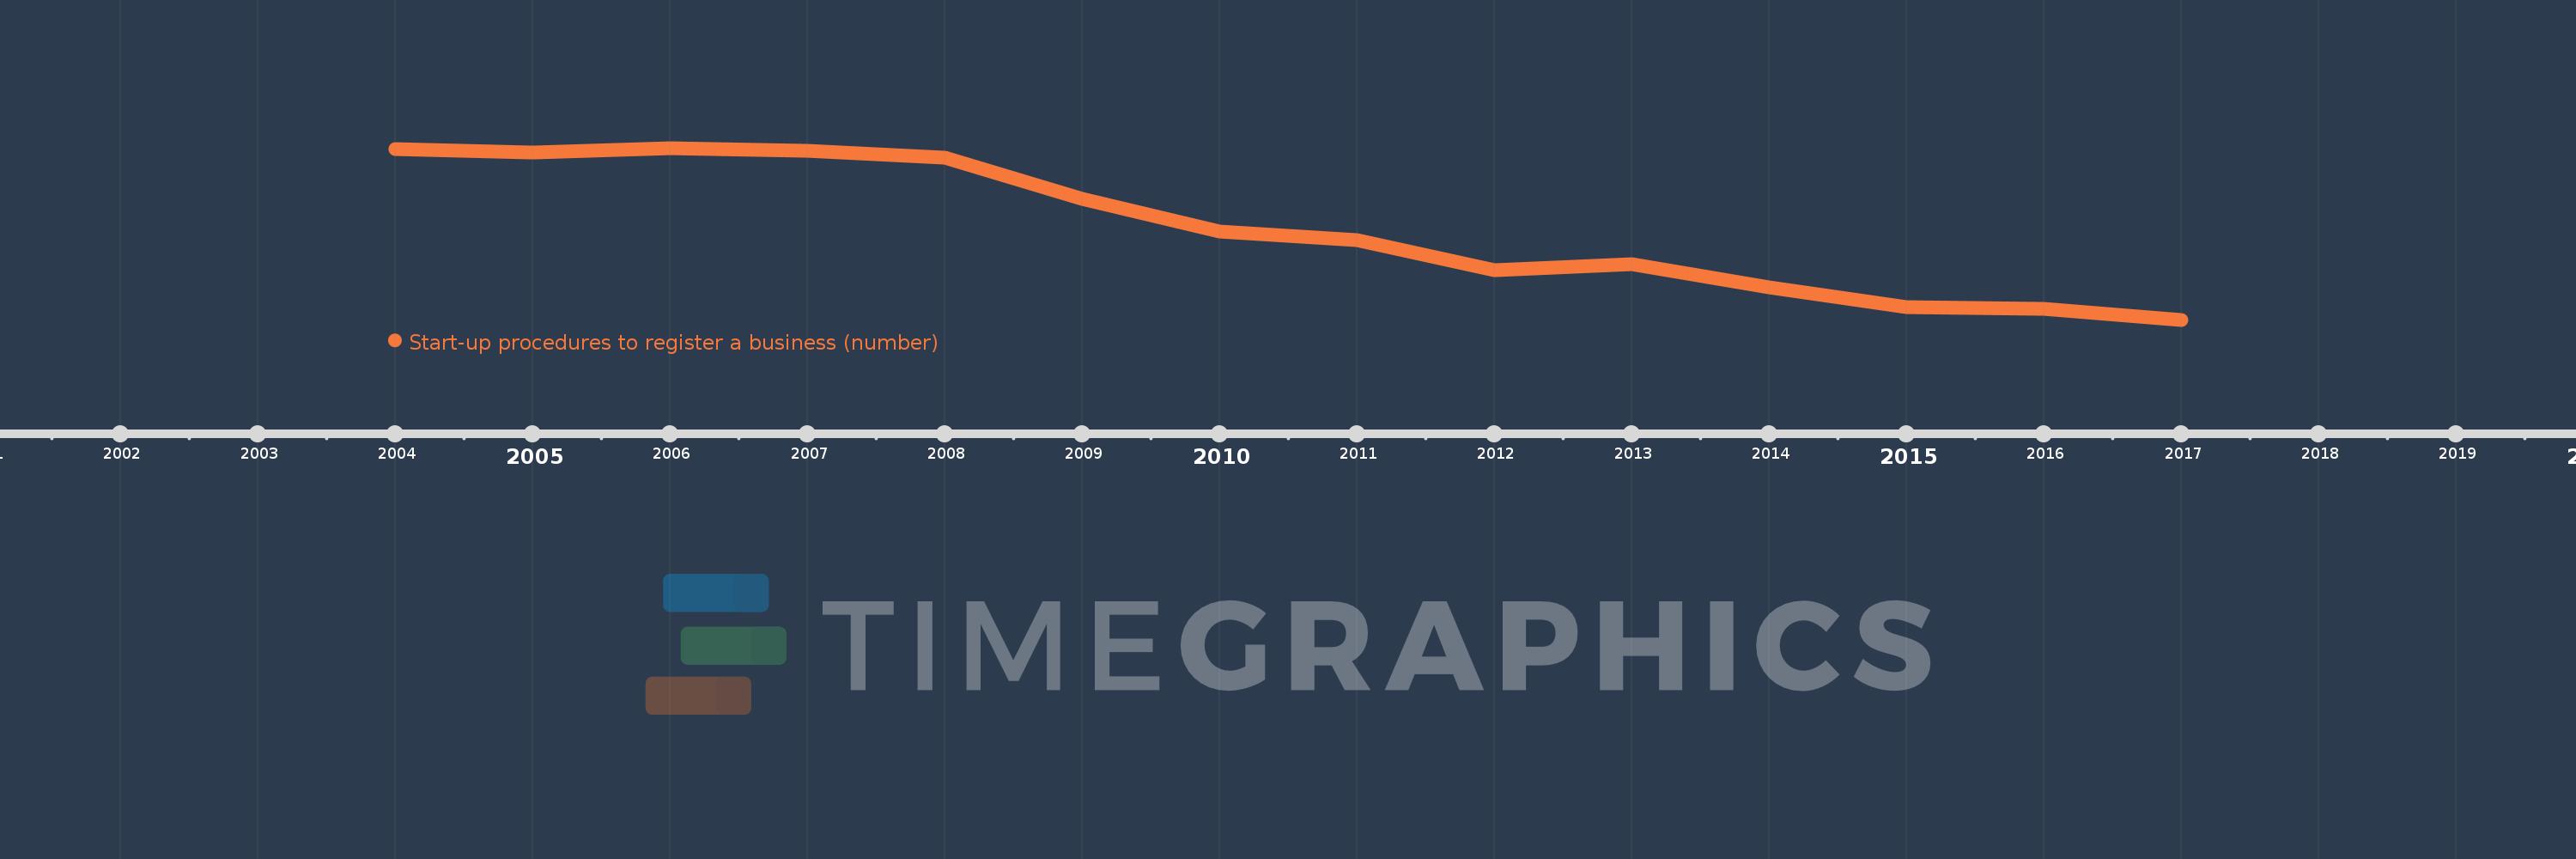
This timeline shows a graph from 2004 to 2017 of Fragile and conflict affected situations. No data until 2003. Number of actual observations by date: 14.
Source name:
World Development Indicators
Source organization:
World Bank, Doing Business project (http://www.doingbusiness.org/).
Categories, topics:
Private Sector
Last updated:
apr 23, 2017
Indicators value changes by year
Meaning:
9.034
Minimum:
7.588
jan 1, 2017
Maximum:
10.286
jan 1, 2006
At the date of observation
Value
Absolute change
Change from the previous value
jan 1, 2004
10.263
+10.263
0.0%
jan 1, 2005
10.208
-0.055
-0.53%
jan 1, 2006
10.286
+0.077
0.76%
jan 1, 2007
10.241
-0.044
-0.43%
jan 1, 2008
10.138
-0.103
-1.01%
jan 1, 2009
9.483
-0.655
-6.46%
jan 1, 2010
8.967
-0.516
-5.44%
jan 1, 2011
8.833
-0.133
-1.49%
jan 1, 2012
8.367
-0.467
-5.28%
jan 1, 2013
8.455
+0.088
1.05%
jan 1, 2014
8.091
-0.364
-4.3%
jan 1, 2015
7.788
-0.303
-3.75%
jan 1, 2016
7.765
-0.023
-0.3%
jan 1, 2017
7.588
-0.176
-2.27%
Ranking of countries by current statistics by years