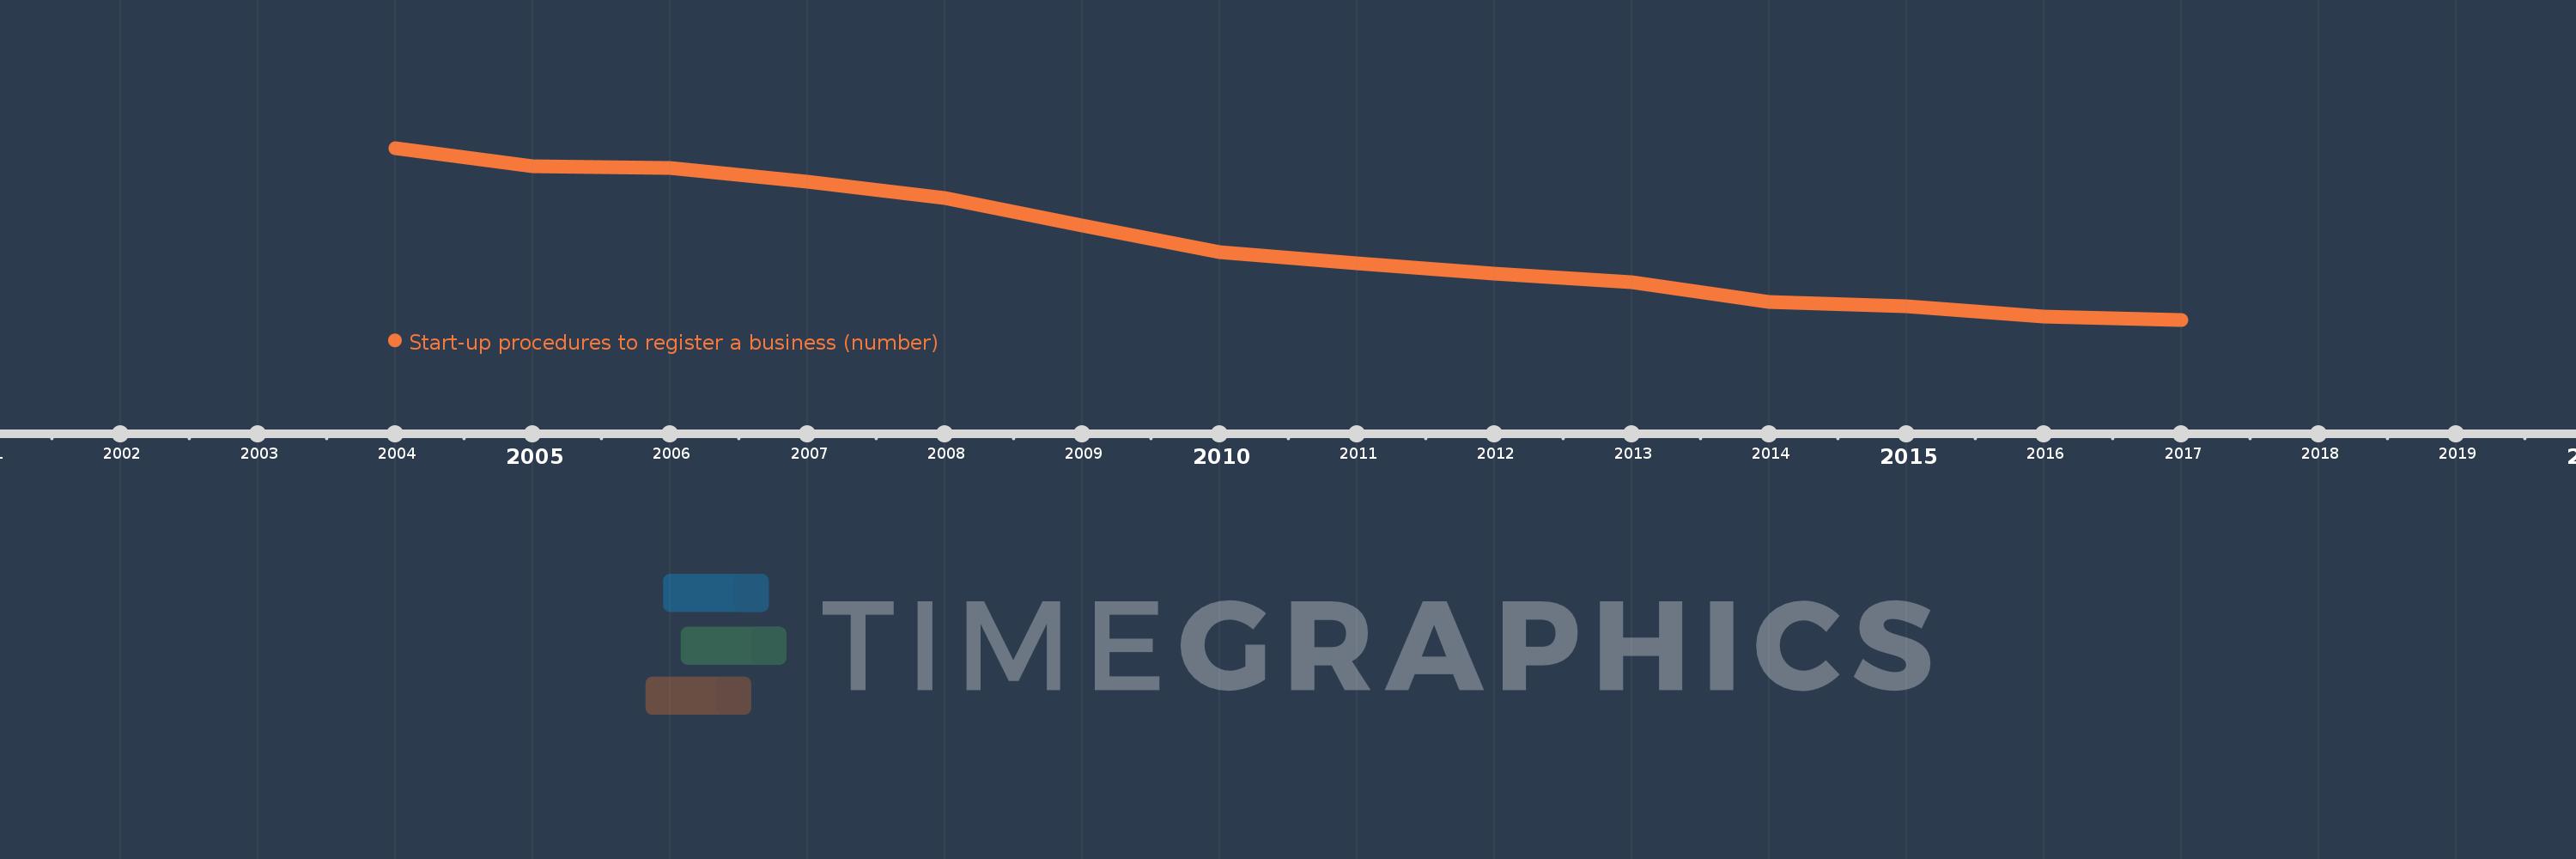
This timeline shows a graph from 2004 to 2017 of Europe & Central Asia (IDA & IBRD countries). No data until 2003. Number of actual observations by date: 14.
Source name:
World Development Indicators
Source organization:
World Bank, Doing Business project (http://www.doingbusiness.org/).
Categories, topics:
Private Sector
Last updated:
apr 23, 2017
Indicators value changes by year
Meaning:
8.003
Minimum:
4.909
jan 1, 2017
Maximum:
11.842
jan 1, 2004
At the date of observation
Value
Absolute change
Change from the previous value
jan 1, 2004
11.842
+11.842
0.0%
jan 1, 2005
11.105
-0.737
-6.22%
jan 1, 2006
11.05
-0.055
-0.5%
jan 1, 2007
10.476
-0.574
-5.19%
jan 1, 2008
9.81
-0.667
-6.36%
jan 1, 2009
8.714
-1.095
-11.17%
jan 1, 2010
7.636
-1.078
-12.37%
jan 1, 2011
7.182
-0.455
-5.95%
jan 1, 2012
6.773
-0.409
-5.7%
jan 1, 2013
6.409
-0.364
-5.37%
jan 1, 2014
5.636
-0.773
-12.06%
jan 1, 2015
5.455
-0.182
-3.23%
jan 1, 2016
5.045
-0.409
-7.5%
jan 1, 2017
4.909
-0.136
-2.7%
Ranking of countries by current statistics by years