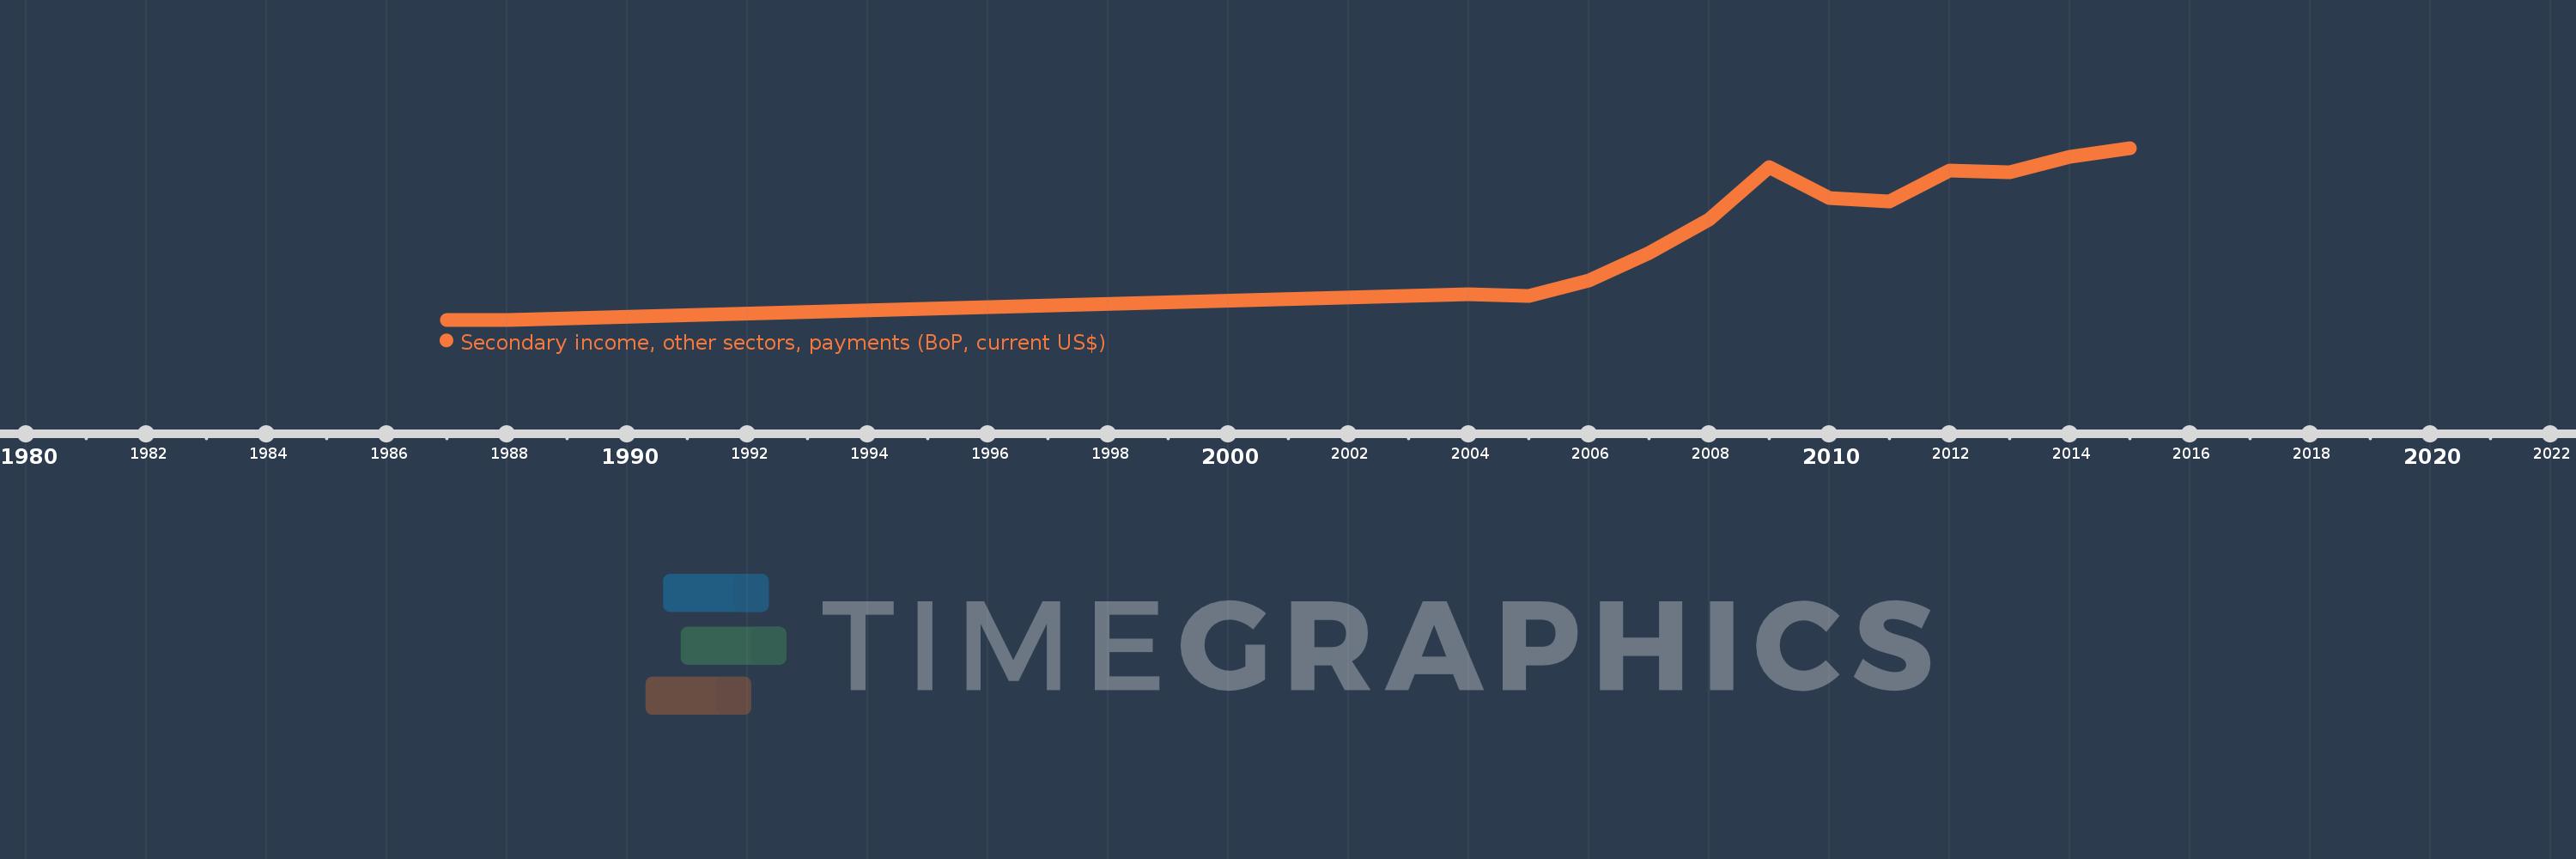
This timeline shows a graph from 1987 to 2015 of Least developed countries: UN classification. No data until 1986. Number of actual observations by date: 14.
Source name:
World Development Indicators
Source organization:
International Monetary Fund, Balance of Payments Statistics Yearbook and data files.
Categories, topics:
Economy & Growth
Last updated:
apr 23, 2017
Indicators value changes by year
Meaning:
4.151 bln
Minimum:
535.83 mln
jan 1, 1987
Maximum:
7.329 bln
jan 1, 2015
At the date of observation
Value
Absolute change
Change from the previous value
jan 1, 1987
535.83 mln
+535.83 mln
0.0%
jan 1, 1988
537.95 mln
+2.12 mln
0.4%
jan 1, 2004
1.533 bln
+994.788 mln
184.92%
jan 1, 2005
1.489 bln
-44.074 mln
-2.88%
jan 1, 2006
2.082 bln
+593.003 mln
39.83%
jan 1, 2007
3.183 bln
+1.101 bln
52.89%
jan 1, 2008
4.49 bln
+1.307 bln
41.08%
jan 1, 2009
6.571 bln
+2.081 bln
46.35%
jan 1, 2010
5.351 bln
-1.22 bln
-18.57%
jan 1, 2011
5.215 bln
-135.594 mln
-2.53%
jan 1, 2012
6.437 bln
+1.222 bln
23.43%
jan 1, 2013
6.375 bln
-62.088 mln
-0.96%
jan 1, 2014
6.987 bln
+612.5 mln
9.61%
jan 1, 2015
7.329 bln
+341.65 mln
4.89%
Ranking of countries by current statistics by years