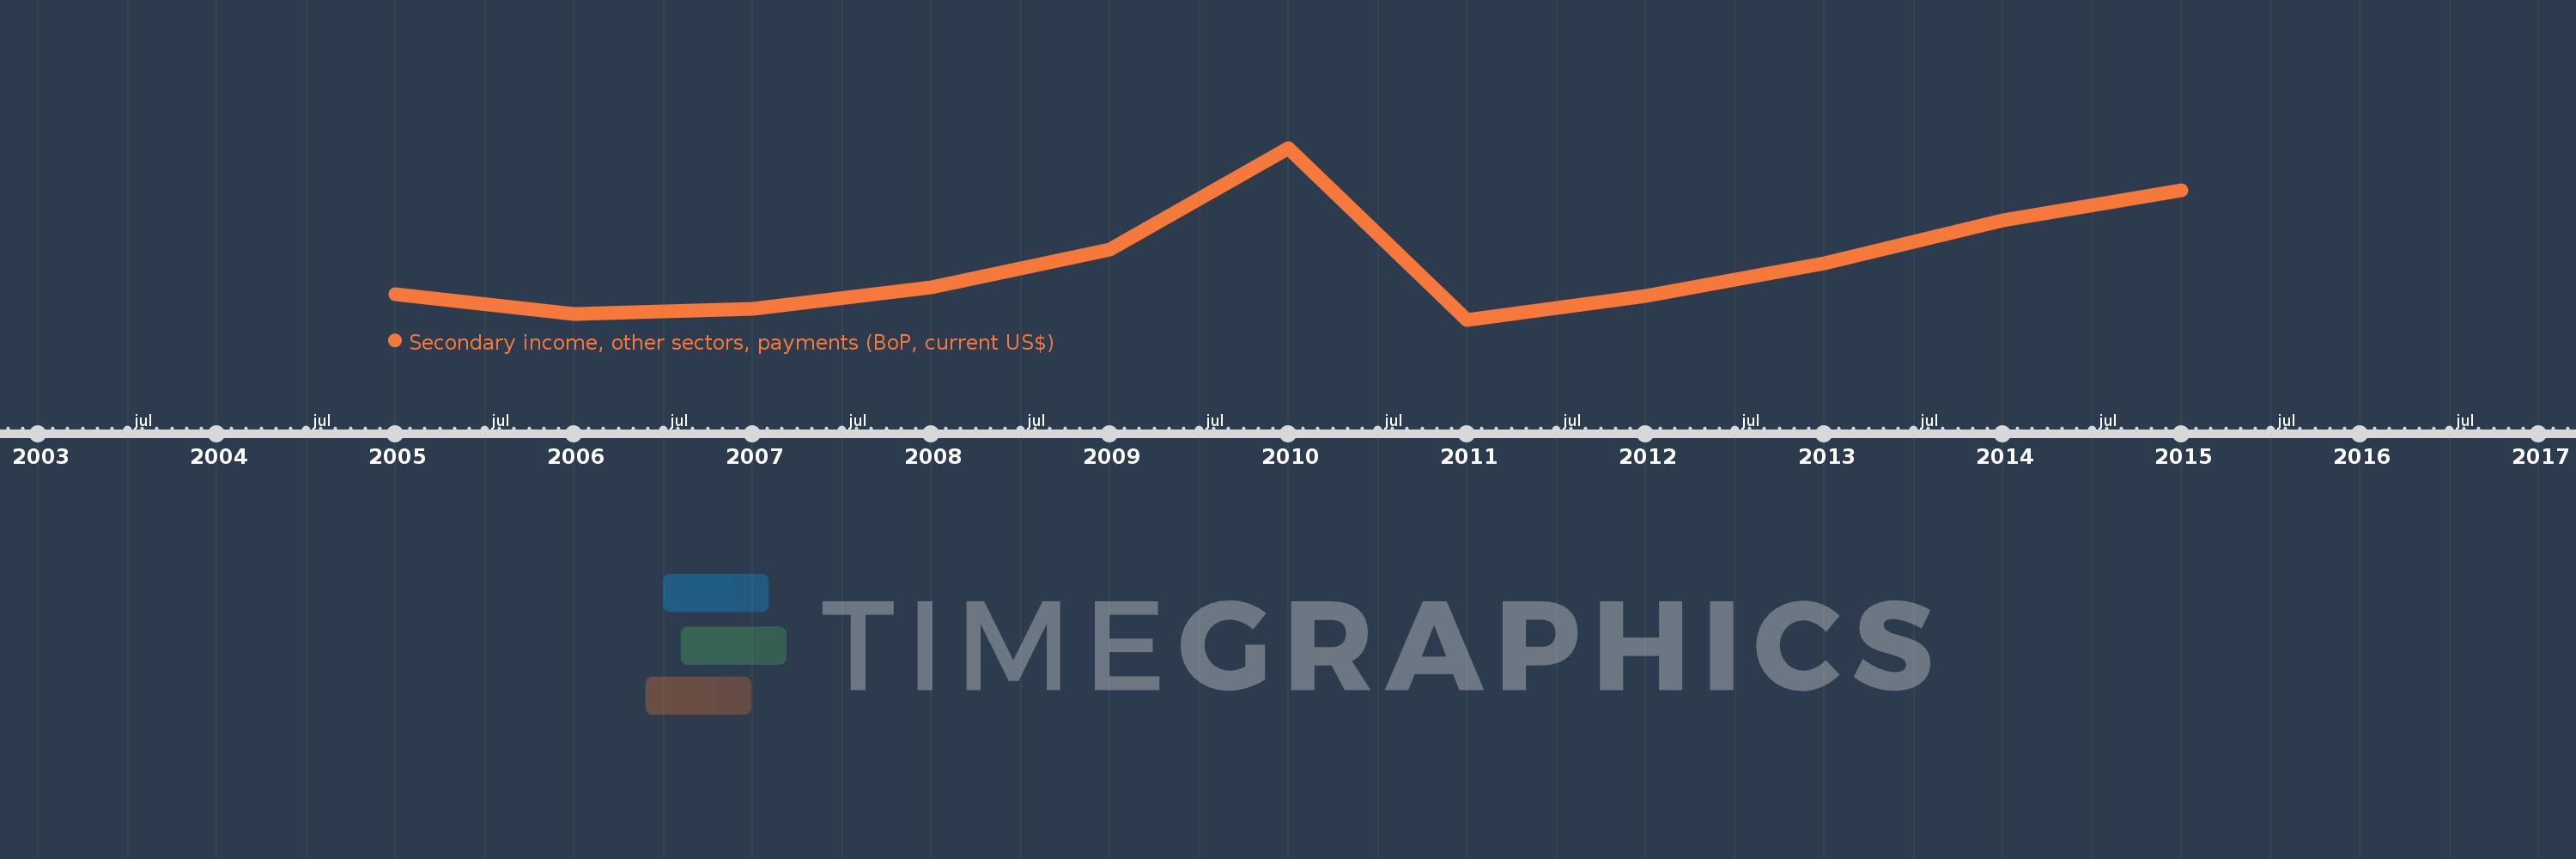
This timeline shows a graph from 2005 to 2015 of East Asia & Pacific (IDA & IBRD countries). No data until 2004. Number of actual observations by date: 11.
Source name:
World Development Indicators
Source organization:
International Monetary Fund, Balance of Payments Statistics Yearbook and data files.
Categories, topics:
Economy & Growth
Last updated:
apr 23, 2017
Indicators value changes by year
Meaning:
8.794 bln
Minimum:
6.74 bln
jan 1, 2011
Maximum:
12.943 bln
jan 1, 2010
At the date of observation
Value
Absolute change
Change from the previous value
jan 1, 2005
7.655 bln
+7.655 bln
0.0%
jan 1, 2006
6.933 bln
-721.472 mln
-9.42%
jan 1, 2007
7.133 bln
+199.427 mln
2.88%
jan 1, 2008
7.915 bln
+782.373 mln
10.97%
jan 1, 2009
9.265 bln
+1.349 bln
17.05%
jan 1, 2010
12.943 bln
+3.678 bln
39.7%
jan 1, 2011
6.74 bln
-6.203 bln
-47.92%
jan 1, 2012
7.611 bln
+870.914 mln
12.92%
jan 1, 2013
8.792 bln
+1.18 bln
15.51%
jan 1, 2014
10.33 bln
+1.538 bln
17.5%
jan 1, 2015
11.413 bln
+1.083 bln
10.48%
Ranking of countries by current statistics by years