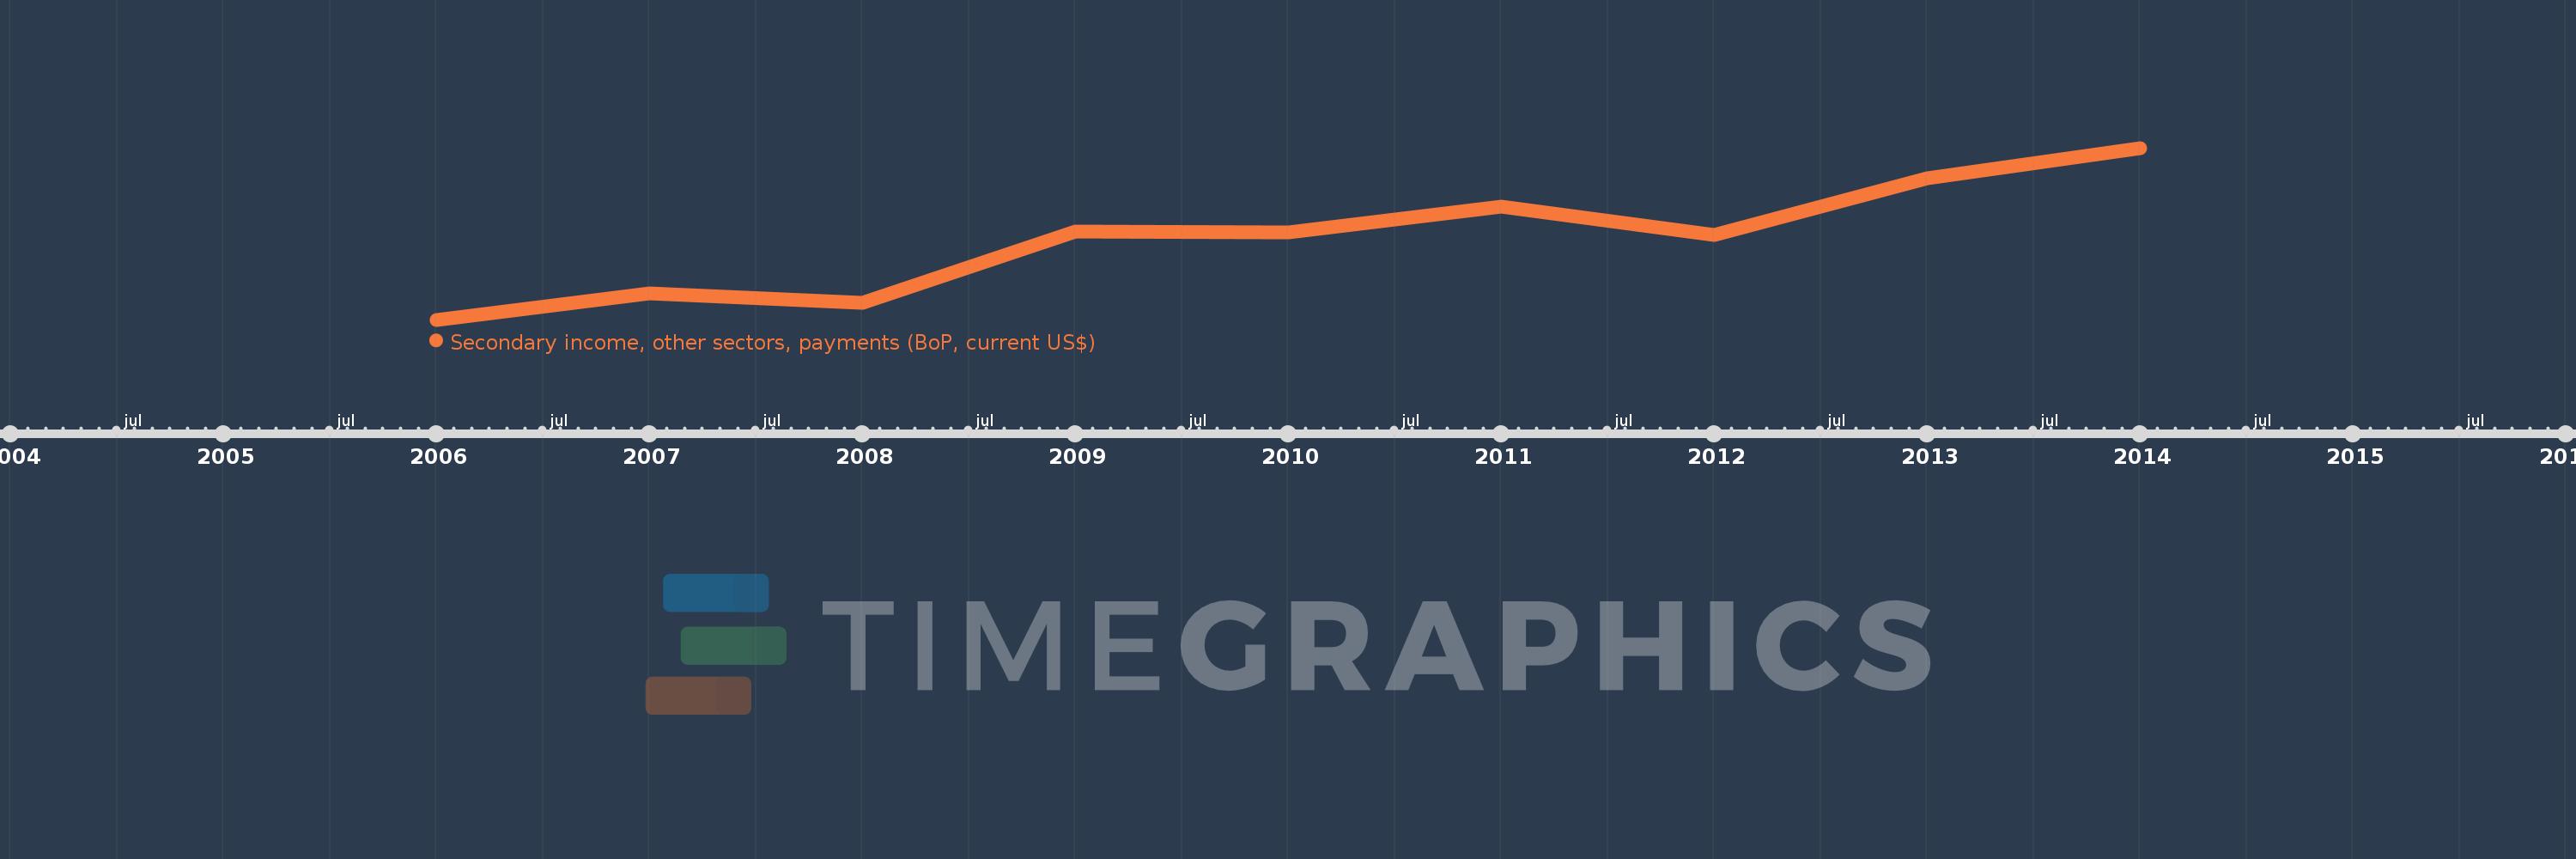
This timeline shows a graph from 2006 to 2014 of Fragile and conflict affected situations. No data until 2005. Number of actual observations by date: 9.
Source name:
World Development Indicators
Source organization:
International Monetary Fund, Balance of Payments Statistics Yearbook and data files.
Categories, topics:
Economy & Growth
Last updated:
apr 23, 2017
Indicators value changes by year
Meaning:
10.73 bln
Minimum:
6.719 bln
jan 1, 2006
Maximum:
15.215 bln
jan 1, 2014
At the date of observation
Value
Absolute change
Change from the previous value
jan 1, 2006
6.719 bln
+6.719 bln
0.0%
jan 1, 2007
8.04 bln
+1.321 bln
19.66%
jan 1, 2008
7.542 bln
-498.508 mln
-6.2%
jan 1, 2009
11.085 bln
+3.543 bln
46.98%
jan 1, 2010
11.029 bln
-56.17 mln
-0.51%
jan 1, 2011
12.313 bln
+1.285 bln
11.65%
jan 1, 2012
10.898 bln
-1.415 bln
-11.49%
jan 1, 2013
13.725 bln
+2.827 bln
25.94%
jan 1, 2014
15.215 bln
+1.49 bln
10.85%
Ranking of countries by current statistics by years