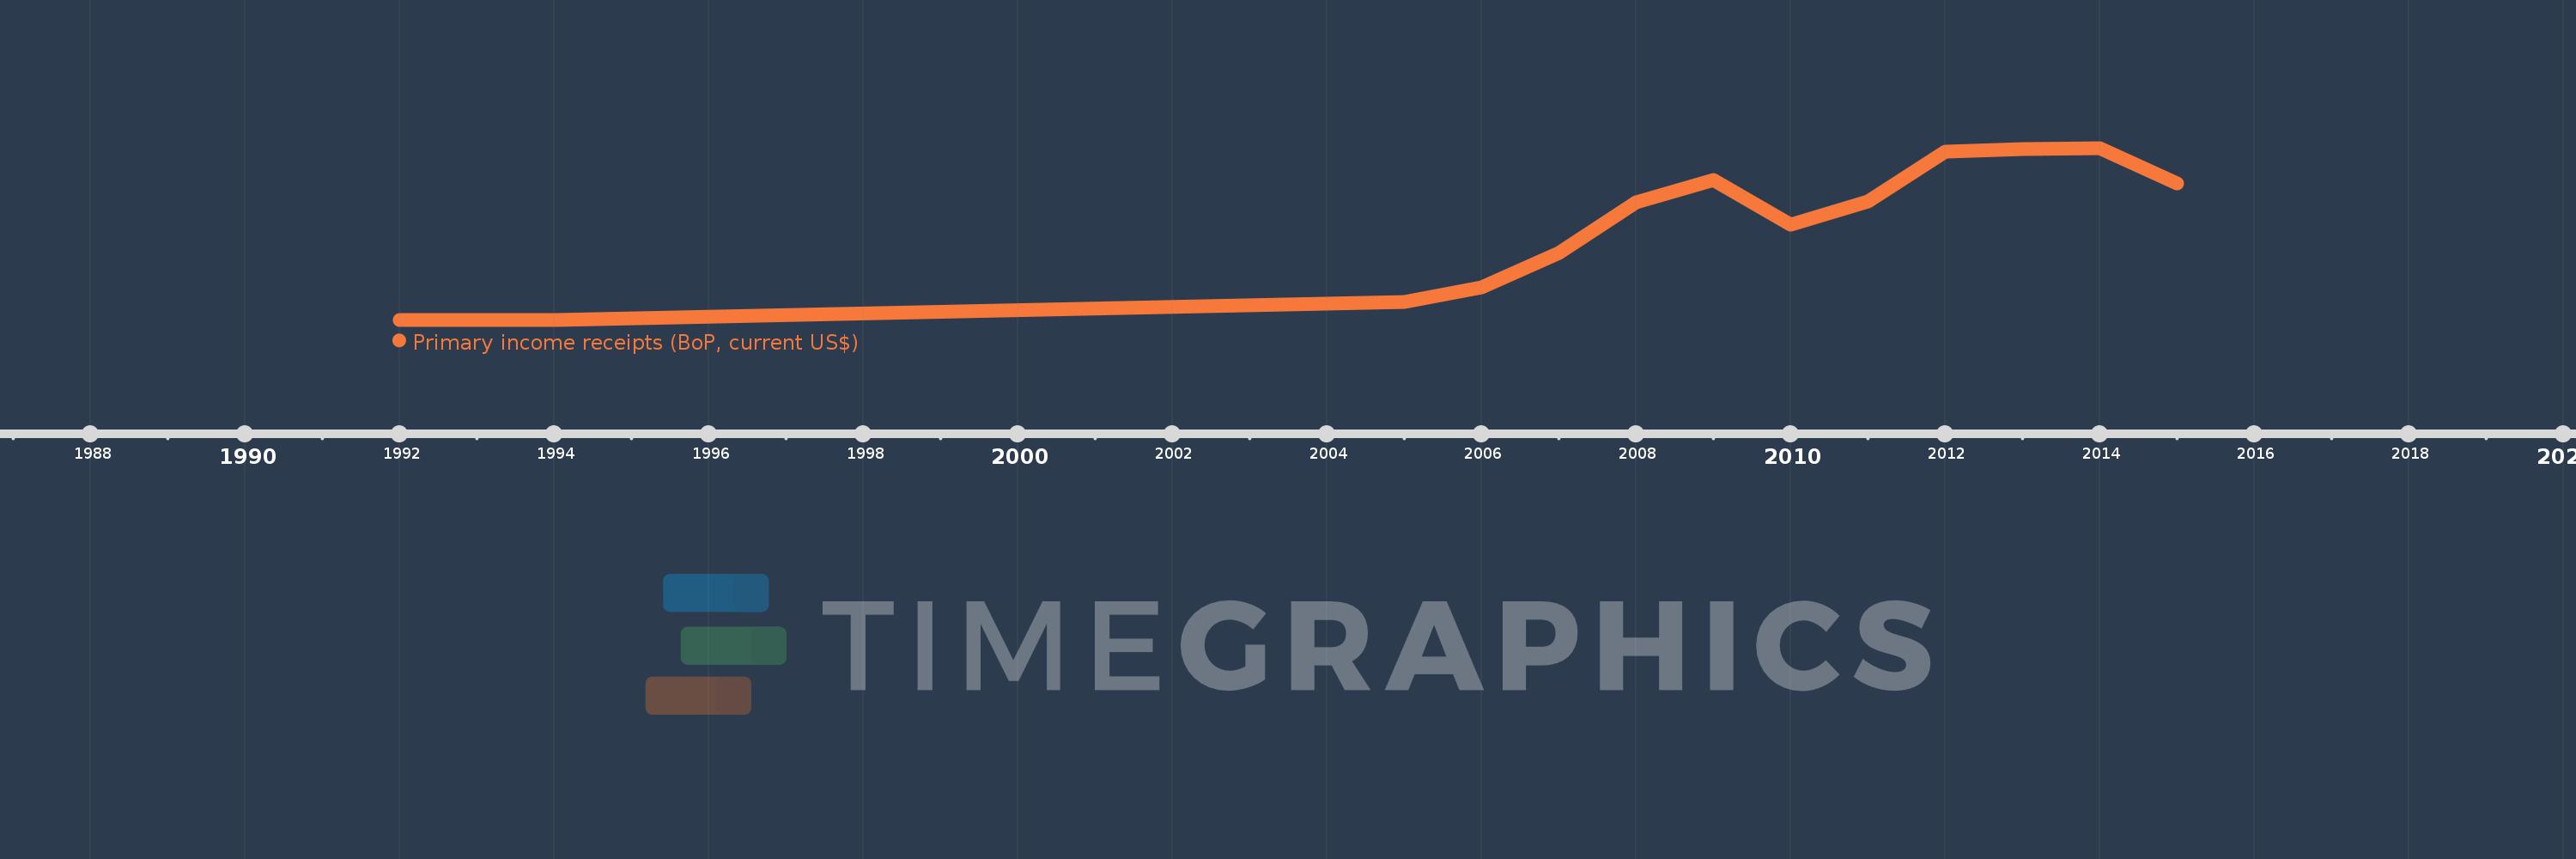
This timeline shows a graph from 1992 to 2015 of Least developed countries: UN classification. No data until 1991. Number of actual observations by date: 13.
Source name:
World Development Indicators
Source organization:
International Monetary Fund, Balance of Payments Statistics Yearbook and data files.
Categories, topics:
Economy & Growth
Last updated:
apr 23, 2017
Indicators value changes by year
Meaning:
4.723 bln
Minimum:
962.704 mln
jan 1, 1992
Maximum:
7.769 bln
jan 1, 2014
At the date of observation
Value
Absolute change
Change from the previous value
jan 1, 1992
962.704 mln
+962.704 mln
0.0%
jan 1, 1994
964.117 mln
+1.412 mln
0.15%
jan 1, 2005
1.652 bln
+687.755 mln
71.34%
jan 1, 2006
2.24 bln
+588.144 mln
35.6%
jan 1, 2007
3.624 bln
+1.384 bln
61.78%
jan 1, 2008
5.625 bln
+2.001 bln
55.21%
jan 1, 2009
6.483 bln
+858.398 mln
15.26%
jan 1, 2010
4.729 bln
-1.754 bln
-27.05%
jan 1, 2011
5.654 bln
+924.546 mln
19.55%
jan 1, 2012
7.616 bln
+1.962 bln
34.71%
jan 1, 2013
7.718 bln
+101.948 mln
1.34%
jan 1, 2014
7.769 bln
+50.742 mln
0.66%
jan 1, 2015
6.358 bln
-1.411 bln
-18.16%
Ranking of countries by current statistics by years