33
/
AIzaSyAYiBZKx7MnpbEhh9jyipgxe19OcubqV5w
August 1, 2025
29444
East Asia & Pacific (IDA & IBRD countries)
TEA
false
2
1
Primary income receipts (BoP, current US$)
2015,2014,2013,2012,2011,2010,2009,2008,2007,2006,2005,2004,2003,2002,1994
Download
Global statistics library →East Asia & Pacific (IDA & IBRD countries) →

Primary income receipts (BoP, current US$)

This statistics in other country:

AfghanistanAlbaniaAlgeriaAngolaAntigua and BarbudaArab WorldArgentinaArmeniaArubaAustraliaAustriaAzerbaijanBahamas, TheBahrainBangladeshBarbadosBelarusBelgiumBelizeBeninBermudaBhutanBoliviaBosnia and HerzegovinaBotswanaBrazilBrunei DarussalamBulgariaBurkina FasoBurundiCabo VerdeCambodiaCameroonCanadaCaribbean small statesCentral African RepublicCentral Europe and the BalticsChadChileChinaColombiaComorosCongo, Dem. Rep.Congo, Rep.Costa RicaCote d'IvoireCroatiaCuracaoCyprusCzech RepublicDenmarkDjiboutiDominicaDominican RepublicEarly-demographic dividendEast Asia & PacificEast Asia & Pacific (excluding high income)East Asia & Pacific (IDA & IBRD countries)EcuadorEgypt, Arab Rep.El SalvadorEquatorial GuineaEritreaEstoniaEthiopiaEuro areaEurope & Central AsiaEurope & Central Asia (excluding high income)Europe & Central Asia (IDA & IBRD countries)European UnionFaroe IslandsFijiFinlandFragile and conflict affected situationsFranceFrench PolynesiaGabonGambia, TheGeorgiaGermanyGhanaGreeceGrenadaGuatemalaGuineaGuinea-BissauGuyanaHaitiHeavily indebted poor countries (HIPC)High incomeHondurasHong Kong SAR, ChinaHungaryIBRD onlyIcelandIDA & IBRD totalIDA blendIDA onlyIDA totalIndiaIndonesiaIran, Islamic Rep.IraqIrelandIsraelItalyJamaicaJapanJordanKazakhstanKenyaKiribatiKorea, Rep.KosovoKuwaitKyrgyz RepublicLao PDRLate-demographic dividendLatin America & Caribbean Latin America & Caribbean (excluding high income)Latin America & the Caribbean (IDA & IBRD countries)LatviaLeast developed countries: UN classificationLebanonLesothoLiberiaLibyaLithuaniaLow & middle incomeLow incomeLower middle incomeLuxembourgMacao SAR, ChinaMacedonia, FYRMadagascarMalawiMalaysiaMaldivesMaliMaltaMarshall IslandsMauritaniaMauritiusMexicoMicronesia, Fed. Sts.Middle East & North AfricaMiddle East & North Africa (excluding high income)Middle East & North Africa (IDA & IBRD countries)Middle incomeMoldovaMongoliaMontenegroMoroccoMozambiqueMyanmarNamibiaNepalNetherlandsNew CaledoniaNew ZealandNicaraguaNigerNigeriaNorth AmericaNorwayOECD membersOmanOther small statesPacific island small statesPakistanPalauPanamaPapua New GuineaParaguayPeruPhilippinesPolandPortugalPost-demographic dividendPre-demographic dividendQatarRomaniaRussian FederationRwandaSamoaSao Tome and PrincipeSaudi ArabiaSenegalSerbiaSeychellesSierra LeoneSingaporeSint Maarten (Dutch part)Slovak RepublicSloveniaSmall statesSolomon IslandsSouth AfricaSouth AsiaSouth Asia (IDA & IBRD)South SudanSpainSri LankaSt. Kitts and NevisSt. LuciaSt. Vincent and the GrenadinesSub-Saharan Africa Sub-Saharan Africa (excluding high income)Sub-Saharan Africa (IDA & IBRD countries)SudanSurinameSwazilandSwedenSwitzerlandSyrian Arab RepublicTajikistanTanzaniaThailandTimor-LesteTogoTongaTrinidad and TobagoTunisiaTurkeyTuvaluUgandaUkraineUnited KingdomUnited StatesUpper middle incomeUruguayVanuatuVenezuela, RBVietnamWest Bank and GazaWorldYemen, Rep.ZambiaZimbabwe

Timeline:

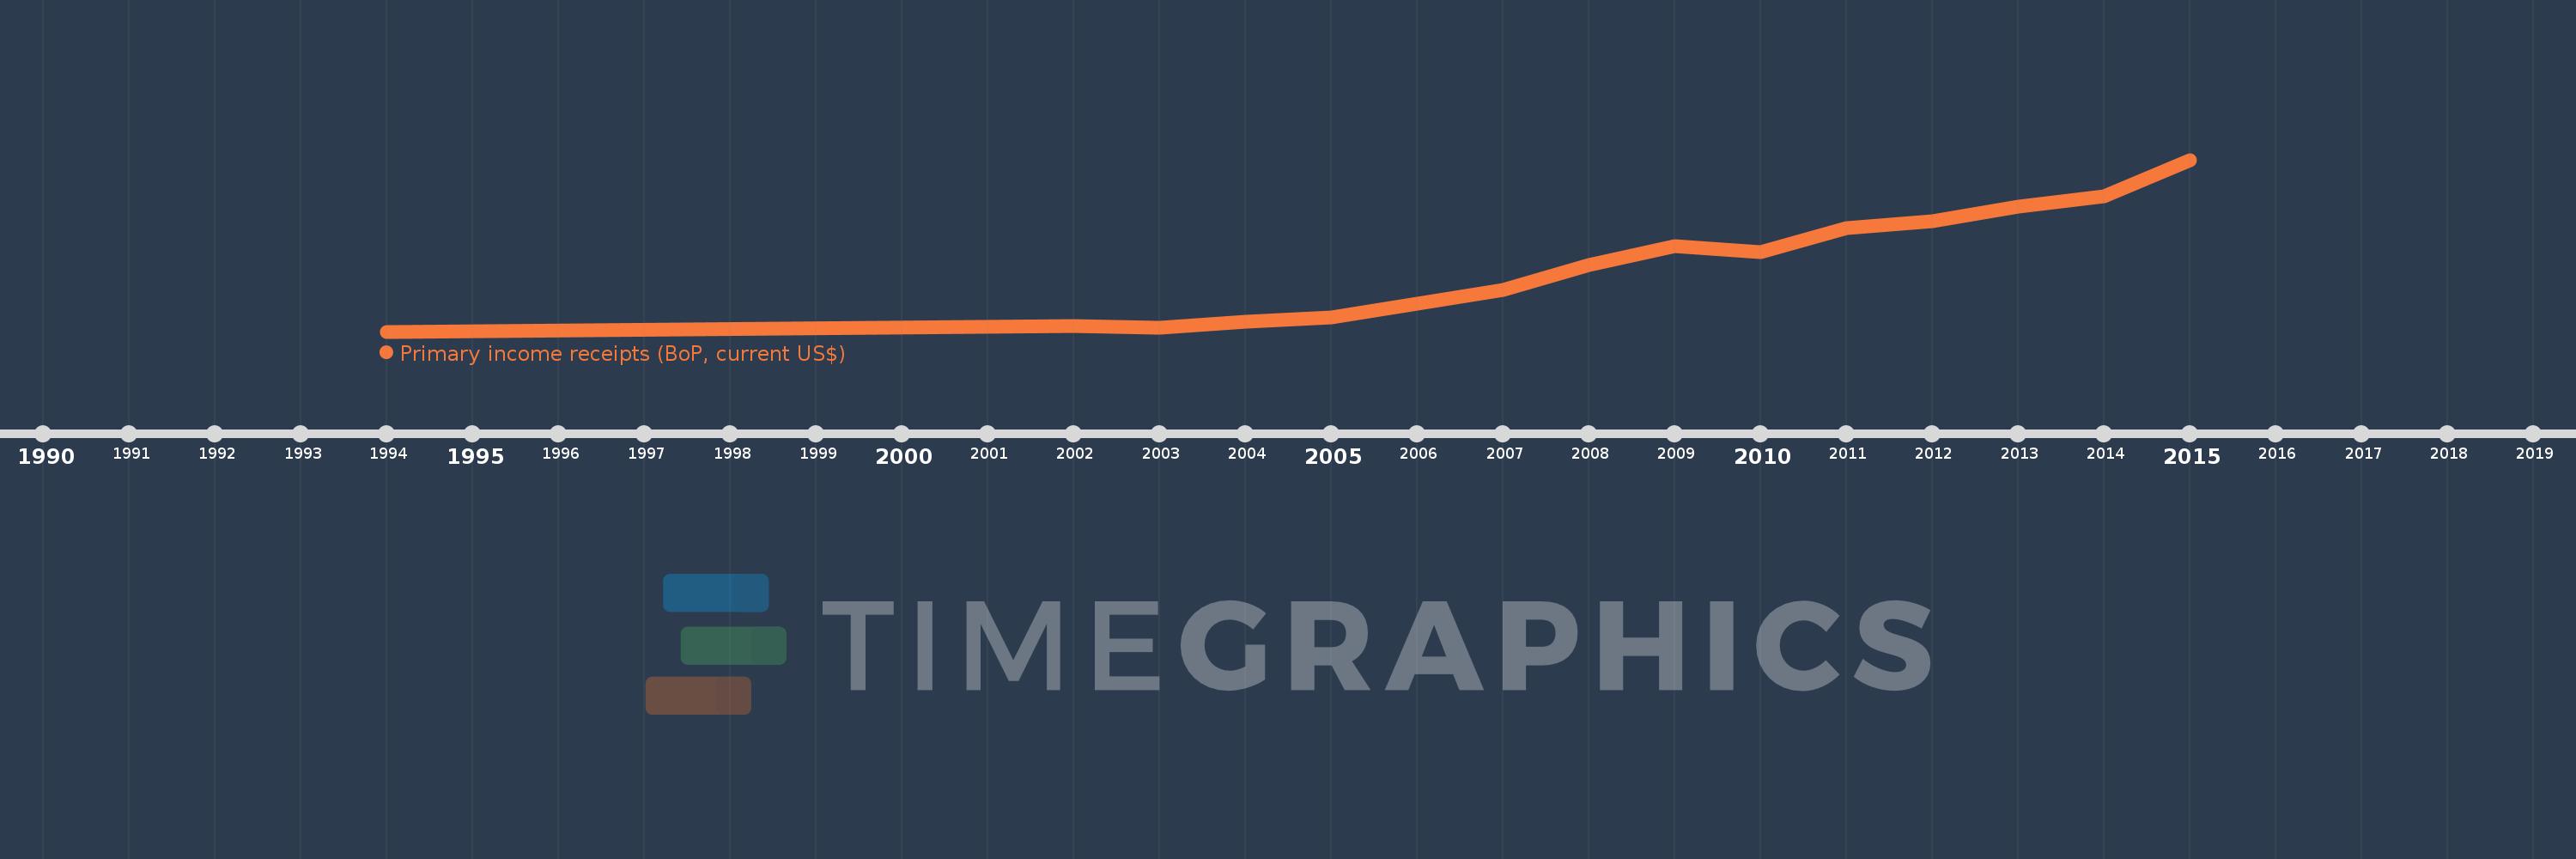
This timeline shows a graph from 1994 to 2015 of East Asia & Pacific (IDA & IBRD countries). No data until 1993. Number of actual observations by date: 15.

Source name:

World Development Indicators

Source organization:

International Monetary Fund, Balance of Payments Statistics Yearbook and data files.

Categories, topics:

Economy & Growth

Last updated:

apr 23, 2017

Indicators value changes by year

Meaning:
113.243 bln
Minimum:
12.529 bln
jan 1, 1994
Maximum:
277.16 bln
jan 1, 2015
At the date of observation
Value
Absolute change
Change from the previous value
jan 1, 1994
12.529 bln
+12.529 bln
0.0%
jan 1, 2002
21.272 bln
+8.744 bln
69.79%
jan 1, 2003
18.945 bln
-2.328 bln
-10.94%
jan 1, 2004
27.444 bln
+8.499 bln
44.86%
jan 1, 2005
34.37 bln
+6.926 bln
25.24%
jan 1, 2006
54.903 bln
+20.533 bln
59.74%
jan 1, 2007
76.908 bln
+22.005 bln
40.08%
jan 1, 2008
114.583 bln
+37.675 bln
48.99%
jan 1, 2009
143.956 bln
+29.373 bln
25.63%
jan 1, 2010
135.364 bln
-8.591 bln
-5.97%
jan 1, 2011
172.26 bln
+36.896 bln
27.26%
jan 1, 2012
183.035 bln
+10.774 bln
6.25%
jan 1, 2013
204.804 bln
+21.769 bln
11.89%
jan 1, 2014
221.11 bln
+16.306 bln
7.96%
jan 1, 2015
277.16 bln
+56.05 bln
25.35%

Ranking of countries by current statistics by years