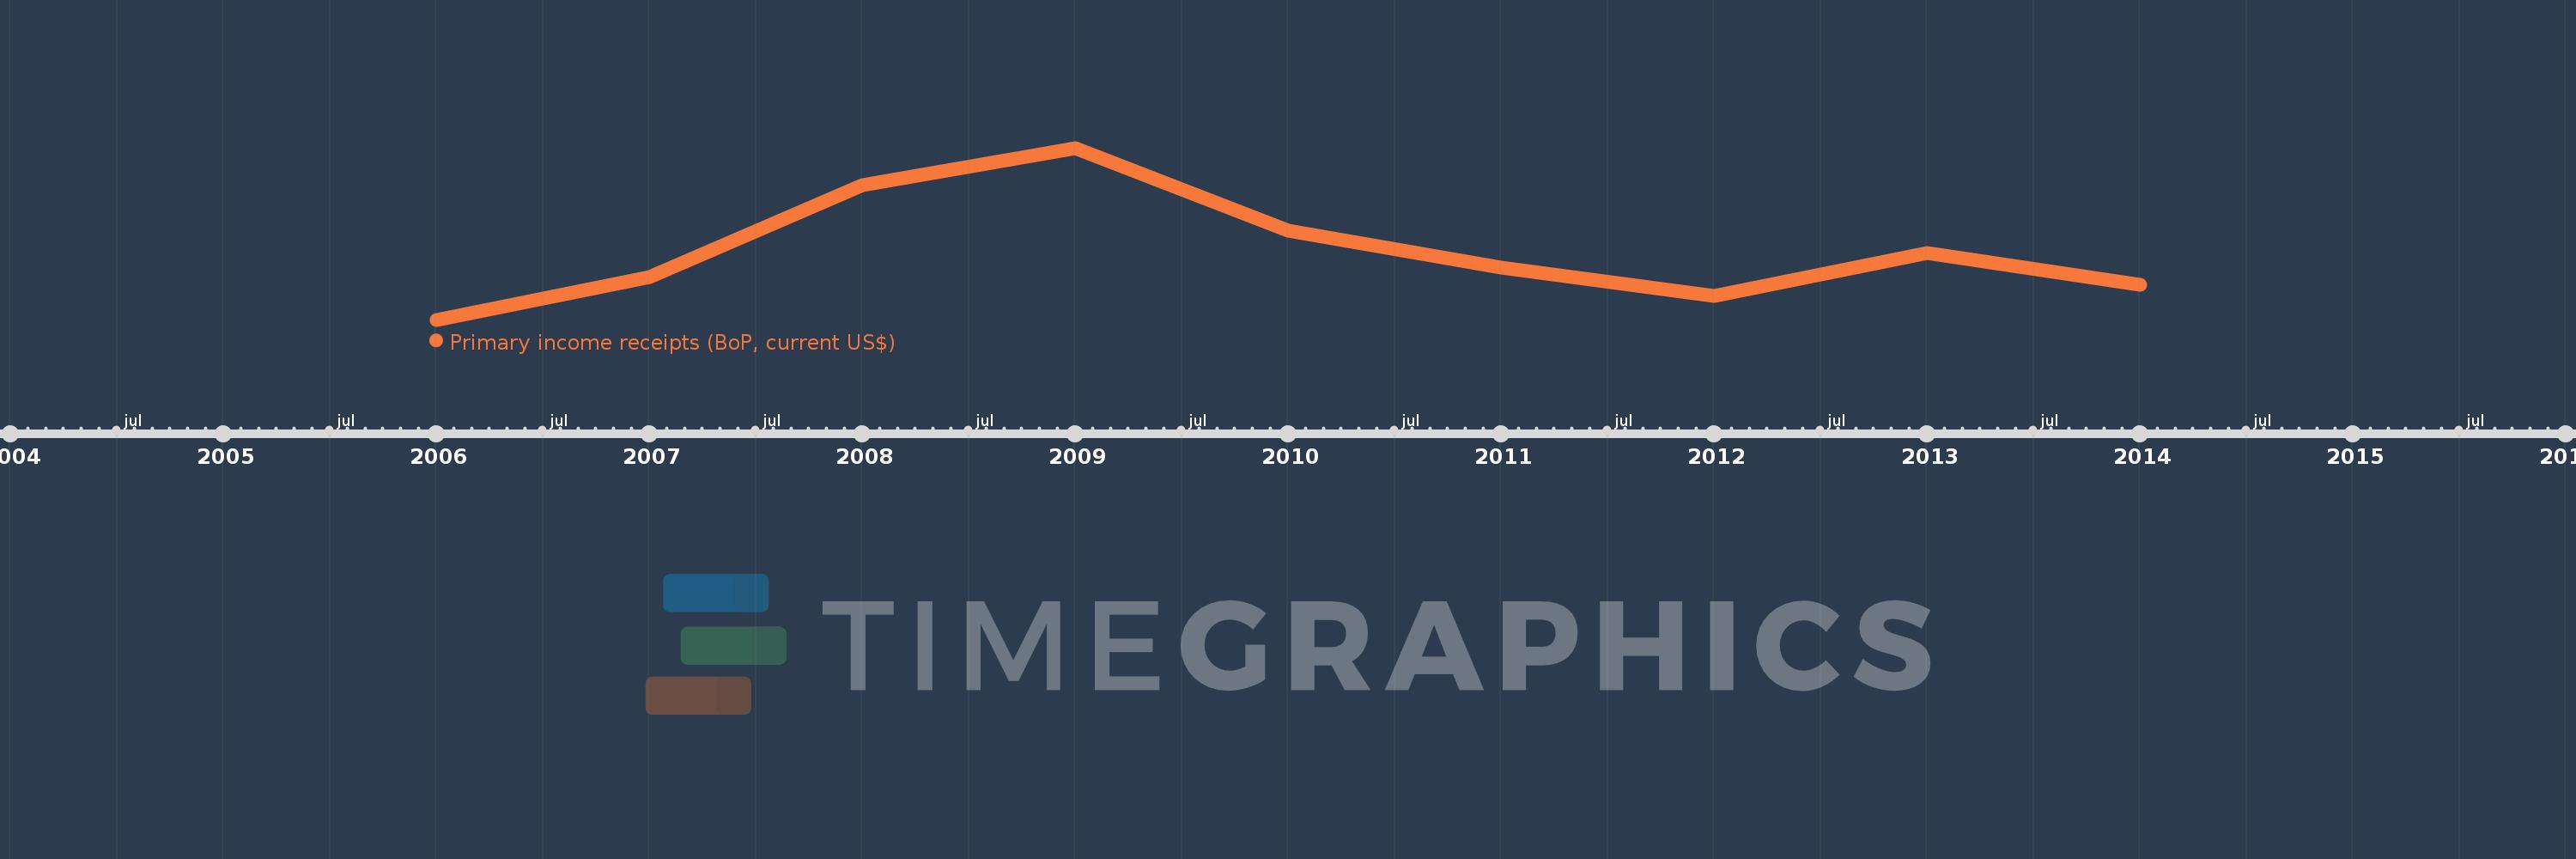
This timeline shows a graph from 2006 to 2014 of Fragile and conflict affected situations. No data until 2005. Number of actual observations by date: 9.
Source name:
World Development Indicators
Source organization:
International Monetary Fund, Balance of Payments Statistics Yearbook and data files.
Categories, topics:
Economy & Growth
Last updated:
apr 23, 2017
Indicators value changes by year
Meaning:
9.353 bln
Minimum:
6.013 bln
jan 1, 2006
Maximum:
14.4 bln
jan 1, 2009
At the date of observation
Value
Absolute change
Change from the previous value
jan 1, 2006
6.013 bln
+6.013 bln
0.0%
jan 1, 2007
8.106 bln
+2.093 bln
34.81%
jan 1, 2008
12.604 bln
+4.497 bln
55.48%
jan 1, 2009
14.4 bln
+1.796 bln
14.25%
jan 1, 2010
10.346 bln
-4.054 bln
-28.15%
jan 1, 2011
8.558 bln
-1.788 bln
-17.28%
jan 1, 2012
7.17 bln
-1.389 bln
-16.23%
jan 1, 2013
9.266 bln
+2.097 bln
29.25%
jan 1, 2014
7.713 bln
-1.553 bln
-16.76%
Ranking of countries by current statistics by years