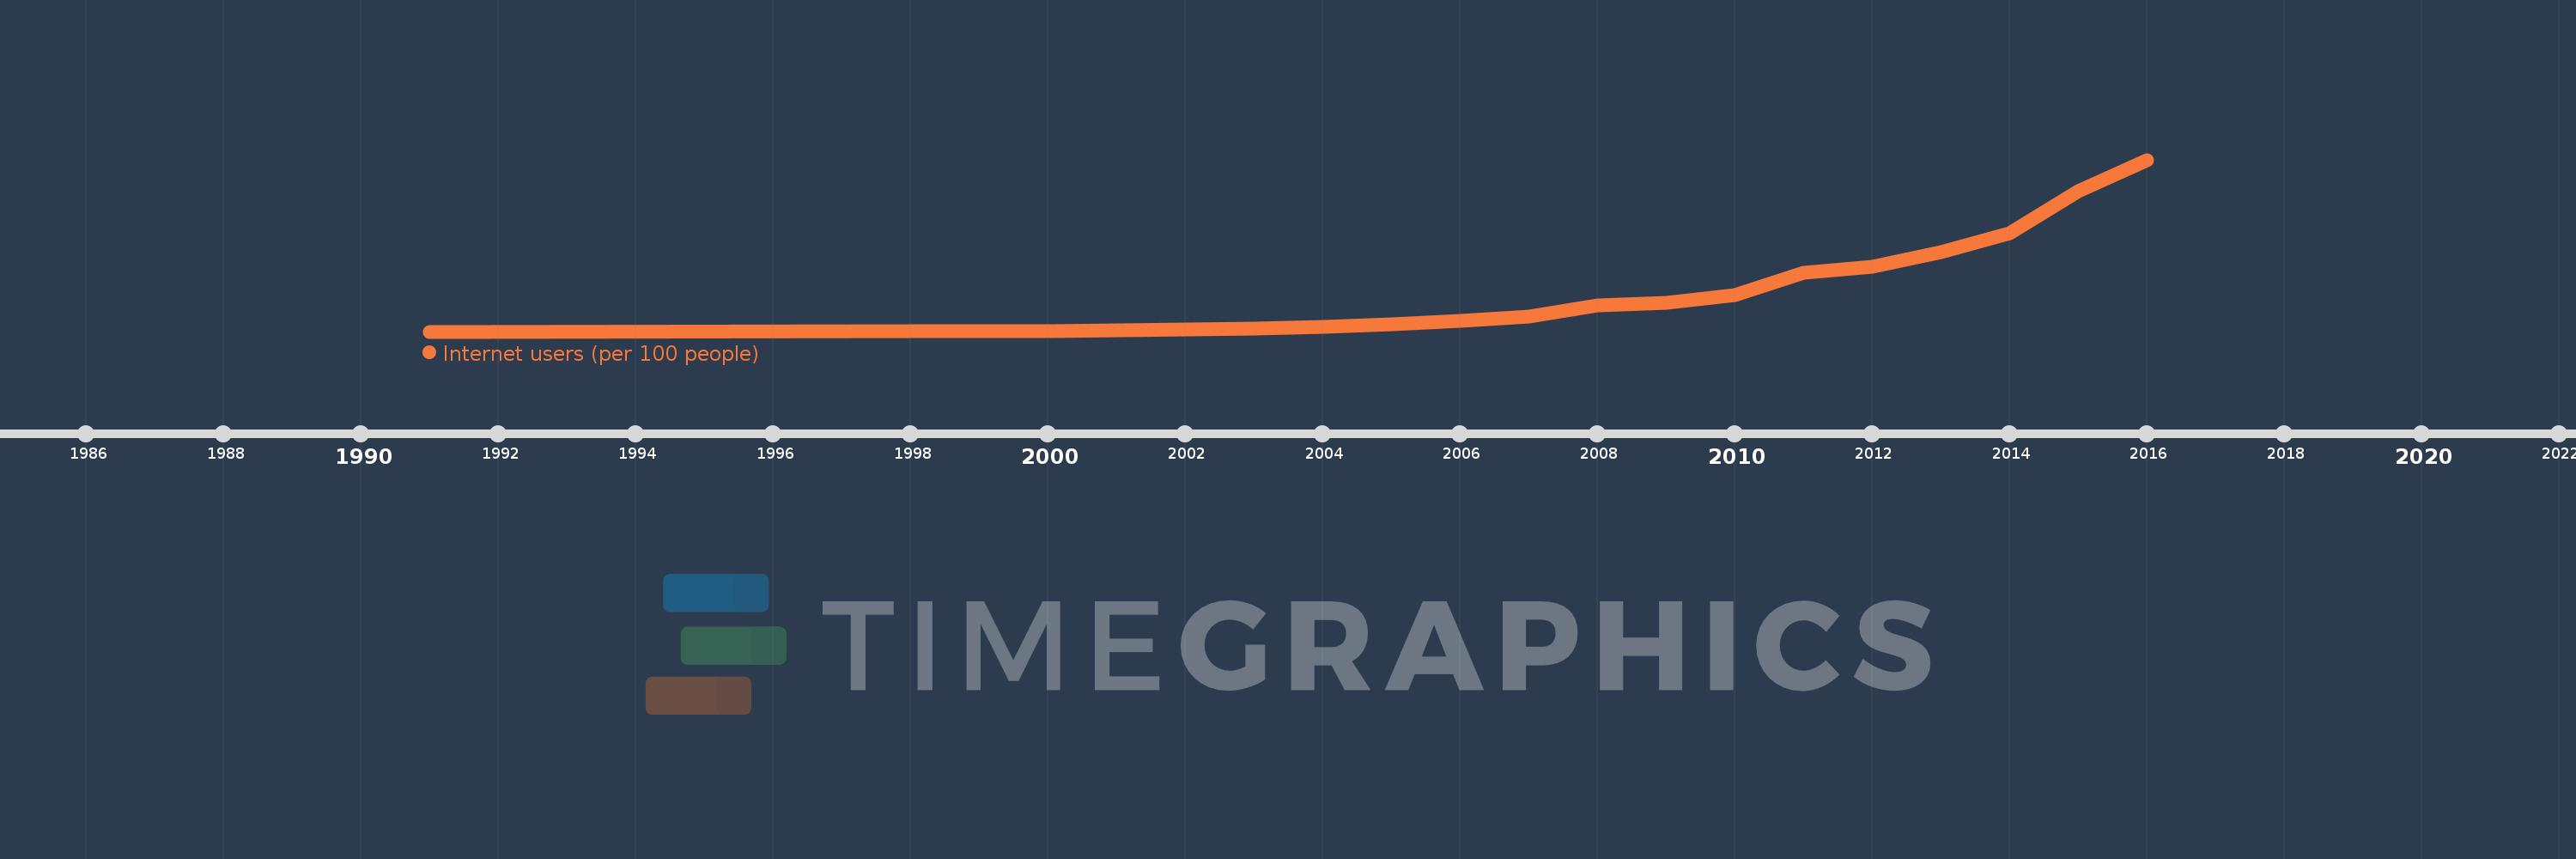
This timeline shows a graph from 1991 to 2016 of Least developed countries: UN classification. No data until 1990. Number of actual observations by date: 20.
Source name:
World Development Indicators
Source organization:
International Telecommunication Union, World Telecommunication/ICT Development Report and database, and World Bank estimates.
Categories, topics:
Infrastructure
Last updated:
apr 23, 2017
Indicators value changes by year
Meaning:
2.761
Minimum:
0.0
jan 1, 1991
Maximum:
12.629
jan 1, 2016
At the date of observation
Value
Absolute change
Change from the previous value
jan 1, 1991
0.0
0.0
0.0%
jan 1, 1998
0.009
+0.009
%
jan 1, 1999
0.021
+0.013
146.9%
jan 1, 2000
0.057
+0.036
171.34%
jan 1, 2001
0.099
+0.042
73.85%
jan 1, 2002
0.145
+0.045
45.5%
jan 1, 2003
0.236
+0.092
63.35%
jan 1, 2004
0.356
+0.119
50.52%
jan 1, 2005
0.555
+0.199
56.04%
jan 1, 2006
0.784
+0.229
41.34%
jan 1, 2007
1.117
+0.333
42.41%
jan 1, 2008
1.922
+0.805
72.05%
jan 1, 2009
2.12
+0.199
10.34%
jan 1, 2010
2.702
+0.582
27.46%
jan 1, 2011
4.303
+1.601
59.24%
jan 1, 2012
4.786
+0.483
11.21%
jan 1, 2013
5.854
+1.068
22.32%
jan 1, 2014
7.199
+1.345
22.98%
jan 1, 2015
10.318
+3.119
43.33%
jan 1, 2016
12.629
+2.31
22.39%
Ranking of countries by current statistics by years