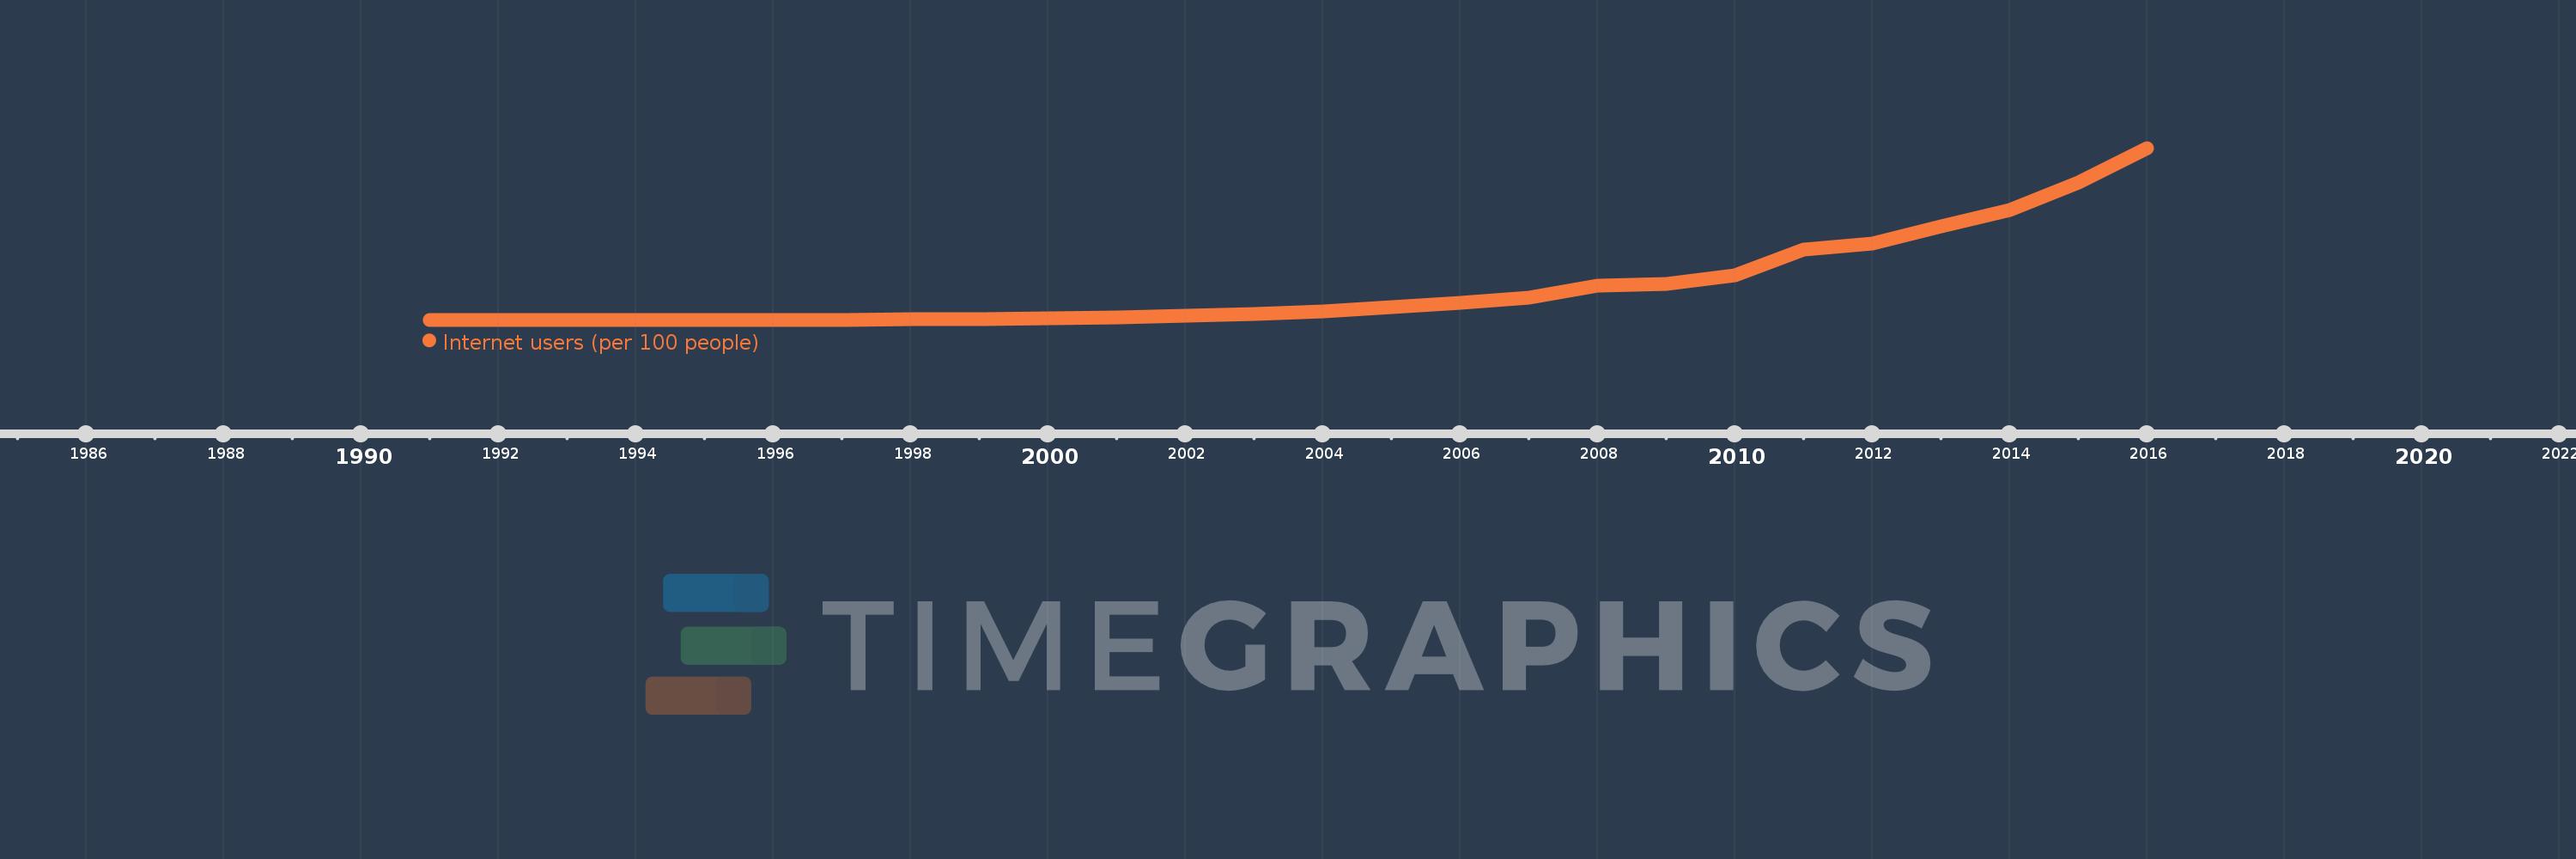
This timeline shows a graph from 1991 to 2016 of Heavily indebted poor countries (HIPC). No data until 1990. Number of actual observations by date: 21.
Source name:
World Development Indicators
Source organization:
International Telecommunication Union, World Telecommunication/ICT Development Report and database, and World Bank estimates.
Categories, topics:
Infrastructure
Last updated:
apr 23, 2017
Indicators value changes by year
Meaning:
2.855
Minimum:
0.0
jan 1, 1991
Maximum:
12.134
jan 1, 2016
At the date of observation
Value
Absolute change
Change from the previous value
jan 1, 1991
0.0
0.0
0.0%
jan 1, 1997
0.009
+0.009
%
jan 1, 1998
0.024
+0.015
173.79%
jan 1, 1999
0.044
+0.02
83.04%
jan 1, 2000
0.106
+0.063
143.4%
jan 1, 2001
0.173
+0.067
62.86%
jan 1, 2002
0.258
+0.084
48.59%
jan 1, 2003
0.395
+0.137
53.35%
jan 1, 2004
0.604
+0.209
53.0%
jan 1, 2005
0.915
+0.31
51.32%
jan 1, 2006
1.213
+0.299
32.68%
jan 1, 2007
1.558
+0.344
28.39%
jan 1, 2008
2.427
+0.869
55.76%
jan 1, 2009
2.527
+0.101
4.15%
jan 1, 2010
3.153
+0.626
24.77%
jan 1, 2011
4.93
+1.777
56.34%
jan 1, 2012
5.398
+0.468
9.49%
jan 1, 2013
6.608
+1.21
22.42%
jan 1, 2014
7.754
+1.147
17.35%
jan 1, 2015
9.715
+1.961
25.29%
jan 1, 2016
12.134
+2.418
24.89%
Ranking of countries by current statistics by years