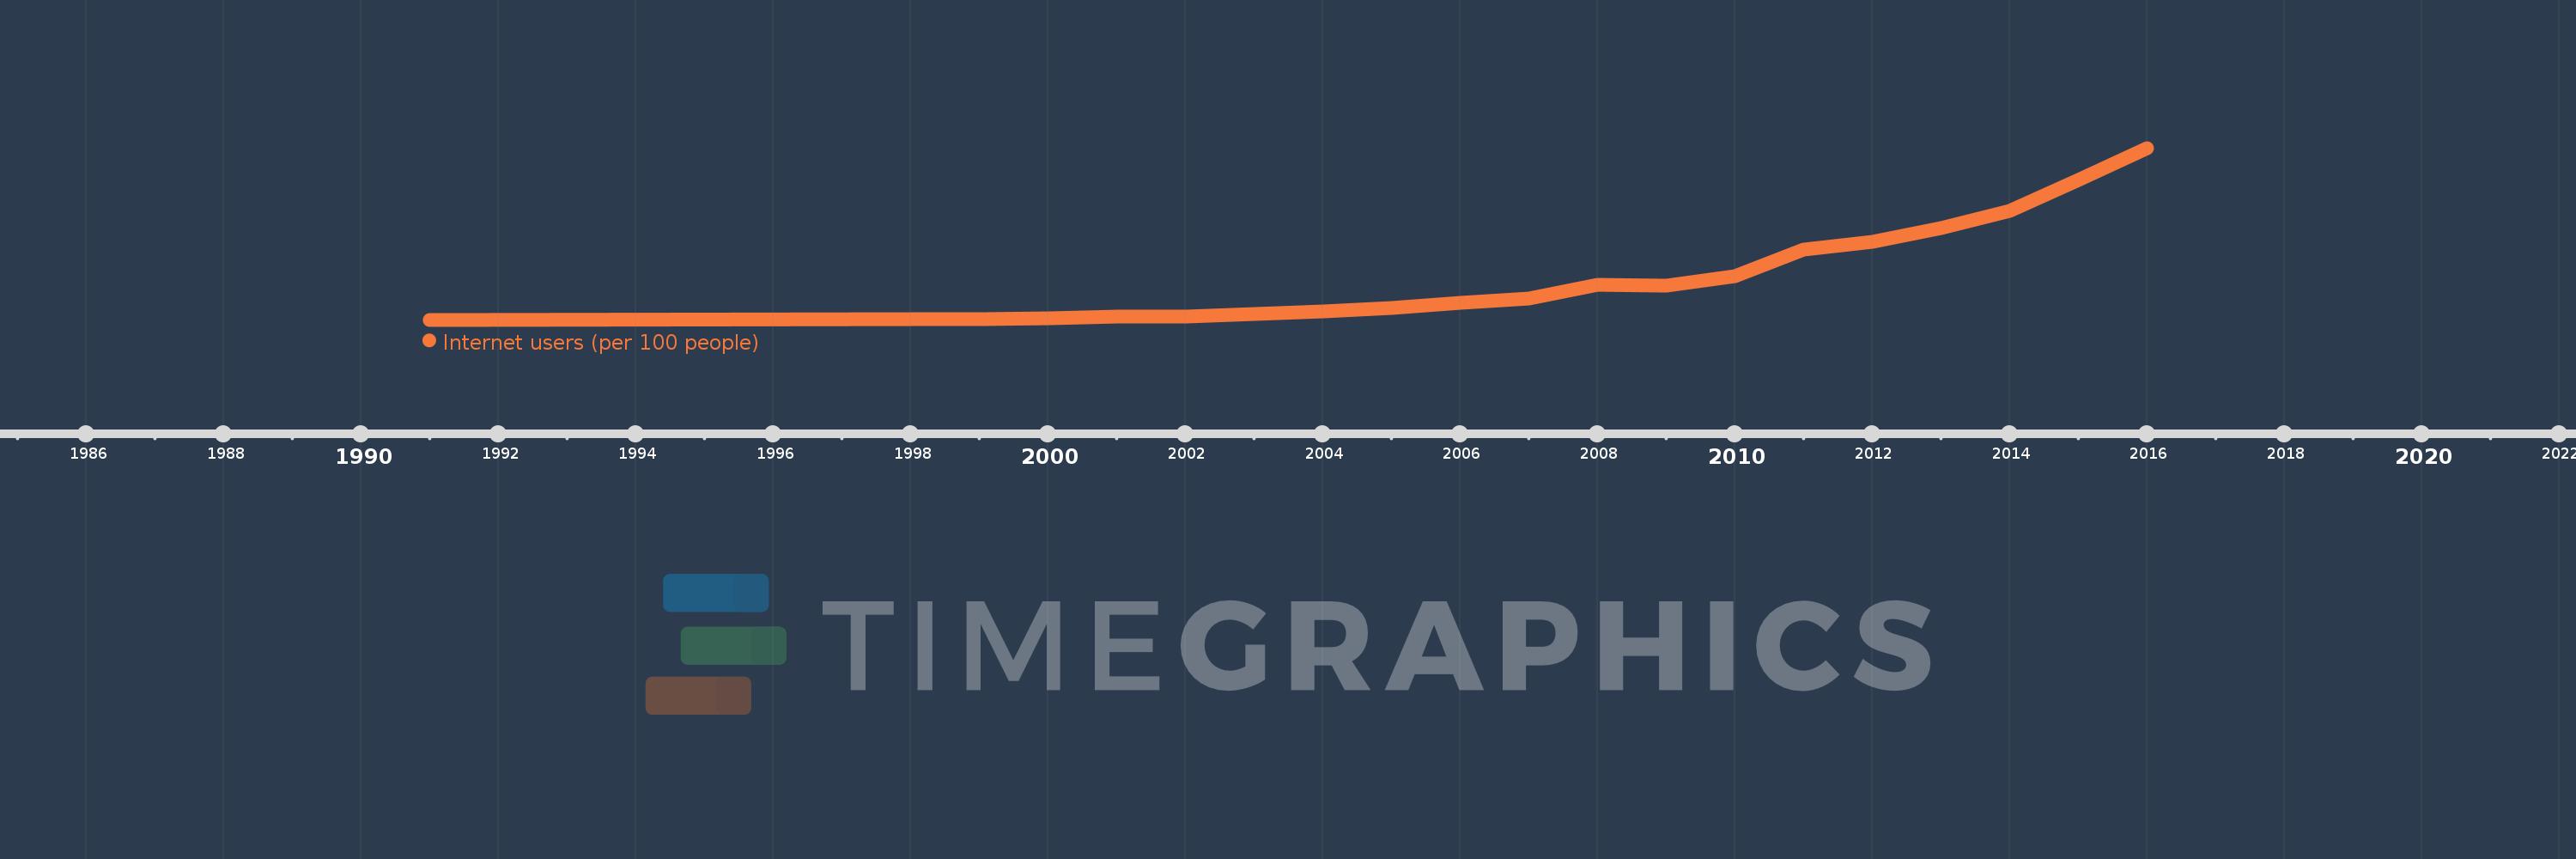
This timeline shows a graph from 1991 to 2016 of Fragile and conflict affected situations. No data until 1990. Number of actual observations by date: 20.
Source name:
World Development Indicators
Source organization:
International Telecommunication Union, World Telecommunication/ICT Development Report and database, and World Bank estimates.
Categories, topics:
Infrastructure
Last updated:
apr 23, 2017
Indicators value changes by year
Meaning:
3.701
Minimum:
0.0
jan 1, 1991
Maximum:
14.986
jan 1, 2016
At the date of observation
Value
Absolute change
Change from the previous value
jan 1, 1991
0.0
0.0
0.0%
jan 1, 1998
0.036
+0.036
%
jan 1, 1999
0.077
+0.041
111.35%
jan 1, 2000
0.134
+0.057
74.25%
jan 1, 2001
0.266
+0.132
98.55%
jan 1, 2002
0.257
-0.01
-3.57%
jan 1, 2003
0.534
+0.278
108.05%
jan 1, 2004
0.753
+0.219
40.98%
jan 1, 2005
1.048
+0.295
39.11%
jan 1, 2006
1.469
+0.42
40.12%
jan 1, 2007
1.885
+0.417
28.37%
jan 1, 2008
3.074
+1.188
63.04%
jan 1, 2009
2.992
-0.082
-2.65%
jan 1, 2010
3.824
+0.831
27.79%
jan 1, 2011
6.146
+2.322
60.74%
jan 1, 2012
6.798
+0.652
10.61%
jan 1, 2013
8.021
+1.223
18.0%
jan 1, 2014
9.494
+1.472
18.35%
jan 1, 2015
12.216
+2.723
28.68%
jan 1, 2016
14.986
+2.77
22.68%
Ranking of countries by current statistics by years