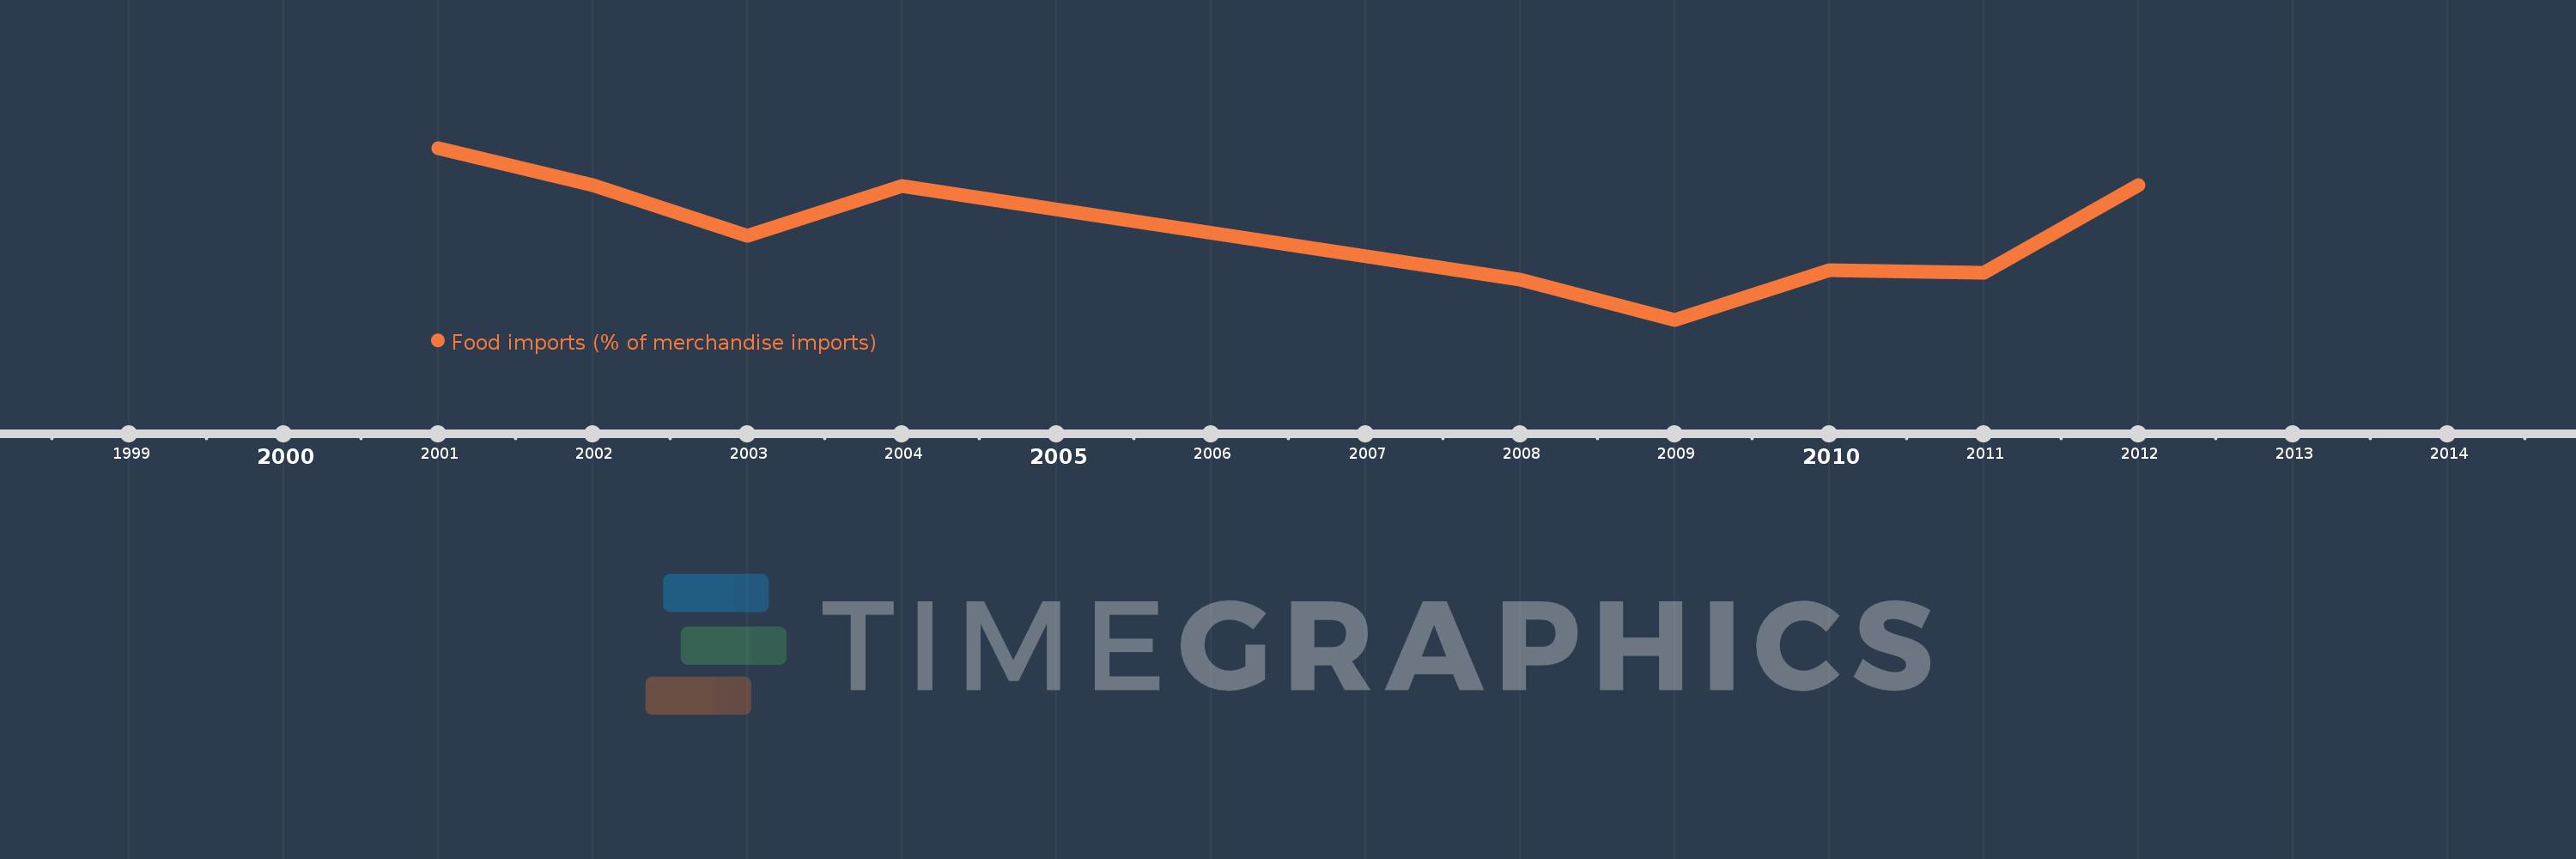
This timeline shows a graph from 2001 to 2012 of Least developed countries: UN classification. No data until 2000. Number of actual observations by date: 9.
Source name:
World Development Indicators
Source organization:
World Bank staff estimates from the Comtrade database maintained by the United Nations Statistics Division.
Categories, topics:
Private Sector, Trade
Last updated:
apr 23, 2017
Indicators value changes by year
Meaning:
16.697
Minimum:
15.667
jan 1, 2009
Maximum:
17.666
jan 1, 2001
At the date of observation
Value
Absolute change
Change from the previous value
jan 1, 2001
17.666
+17.666
0.0%
jan 1, 2002
17.238
-0.428
-2.42%
jan 1, 2003
16.647
-0.591
-3.43%
jan 1, 2004
17.228
+0.581
3.49%
jan 1, 2008
16.133
-1.095
-6.36%
jan 1, 2009
15.667
-0.466
-2.89%
jan 1, 2010
16.24
+0.573
3.66%
jan 1, 2011
16.216
-0.024
-0.15%
jan 1, 2012
17.235
+1.019
6.28%
Ranking of countries by current statistics by years