33
/
AIzaSyB4mHJ5NPEv-XzF7P6NDYXjlkCWaeKw5bc
November 30, 2025
157261
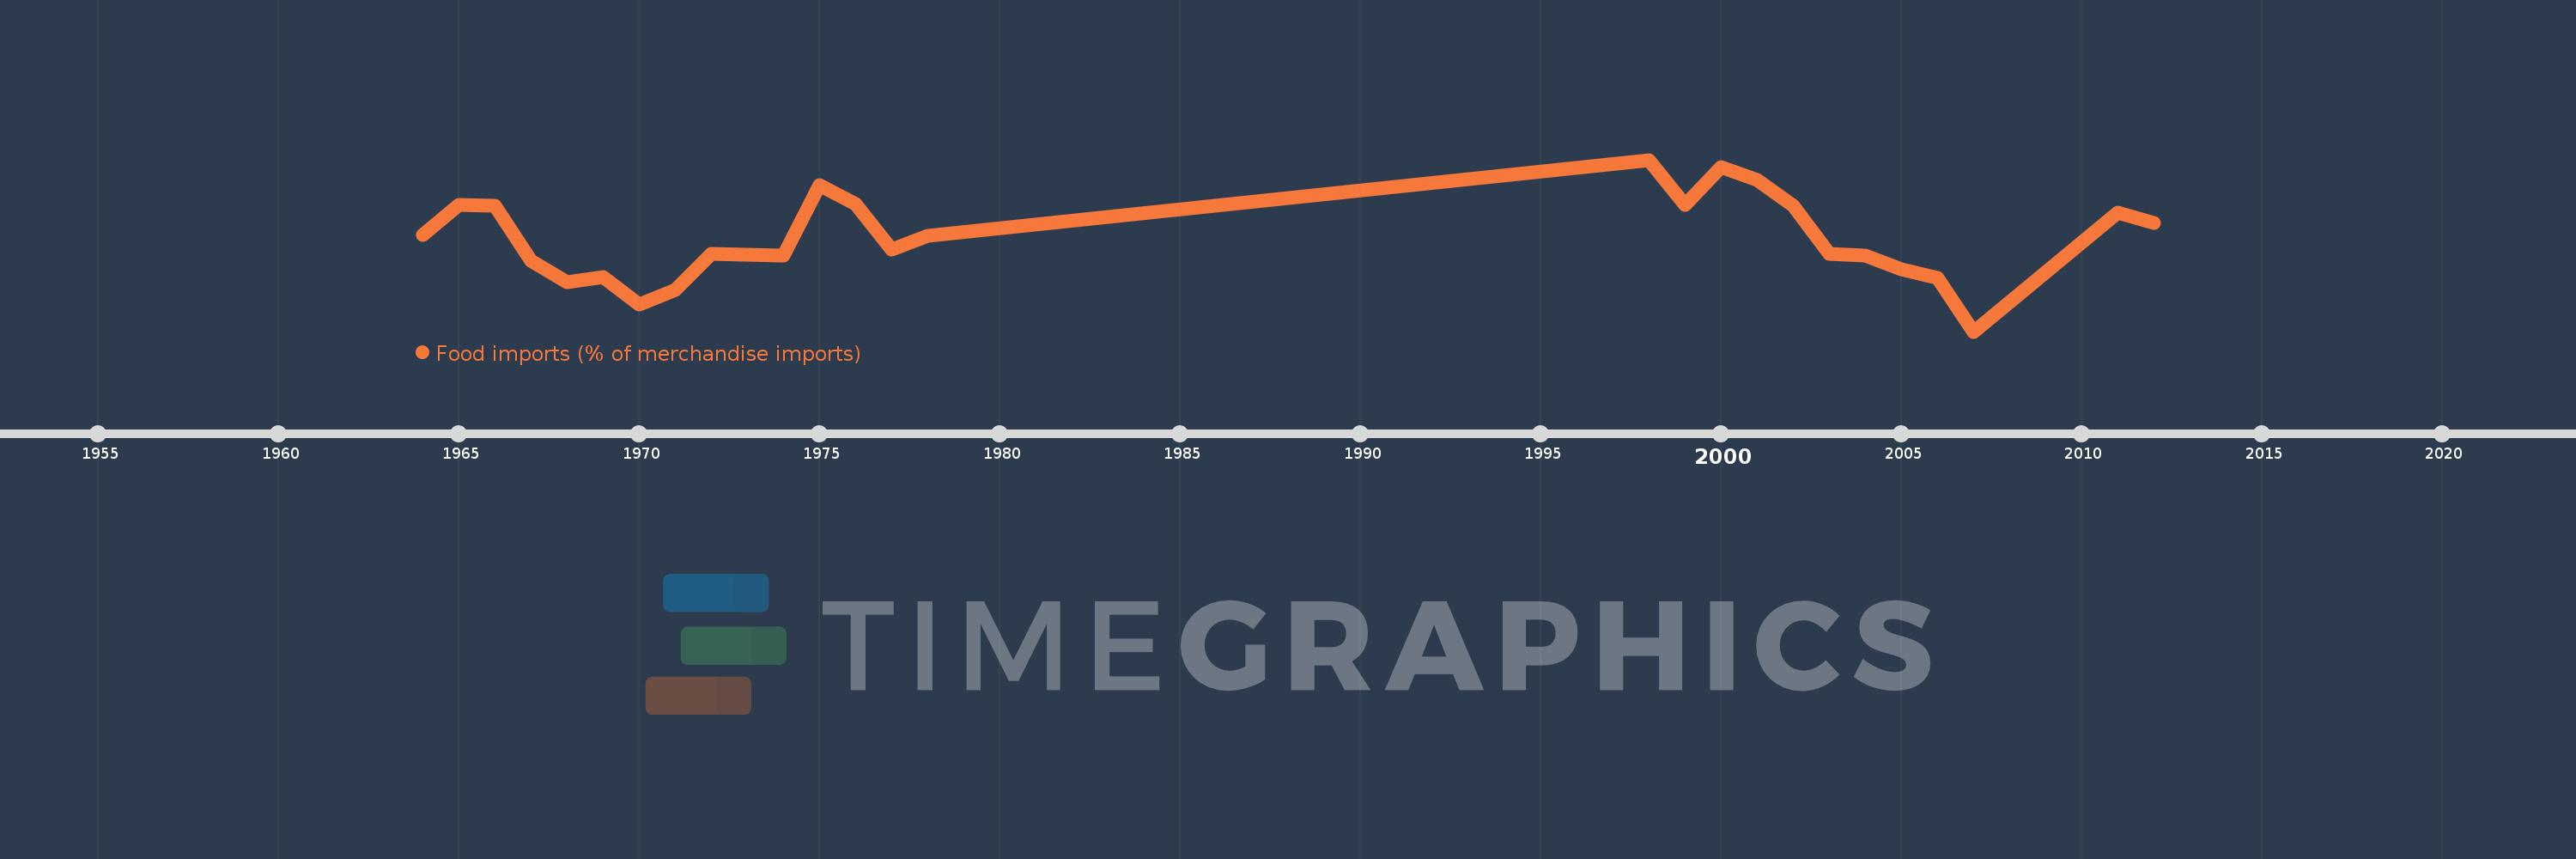
Iran, Islamic Rep.
IRN
true
2
1
Food imports (% of merchandise imports)
2012,2011,2007,2006,2005,2004,2003,2002,2001,2000,1999,1998,1978,1977,1976,1975,1974,1973,1972,1971,1970,1969,1968,1967,1966,1965,1964