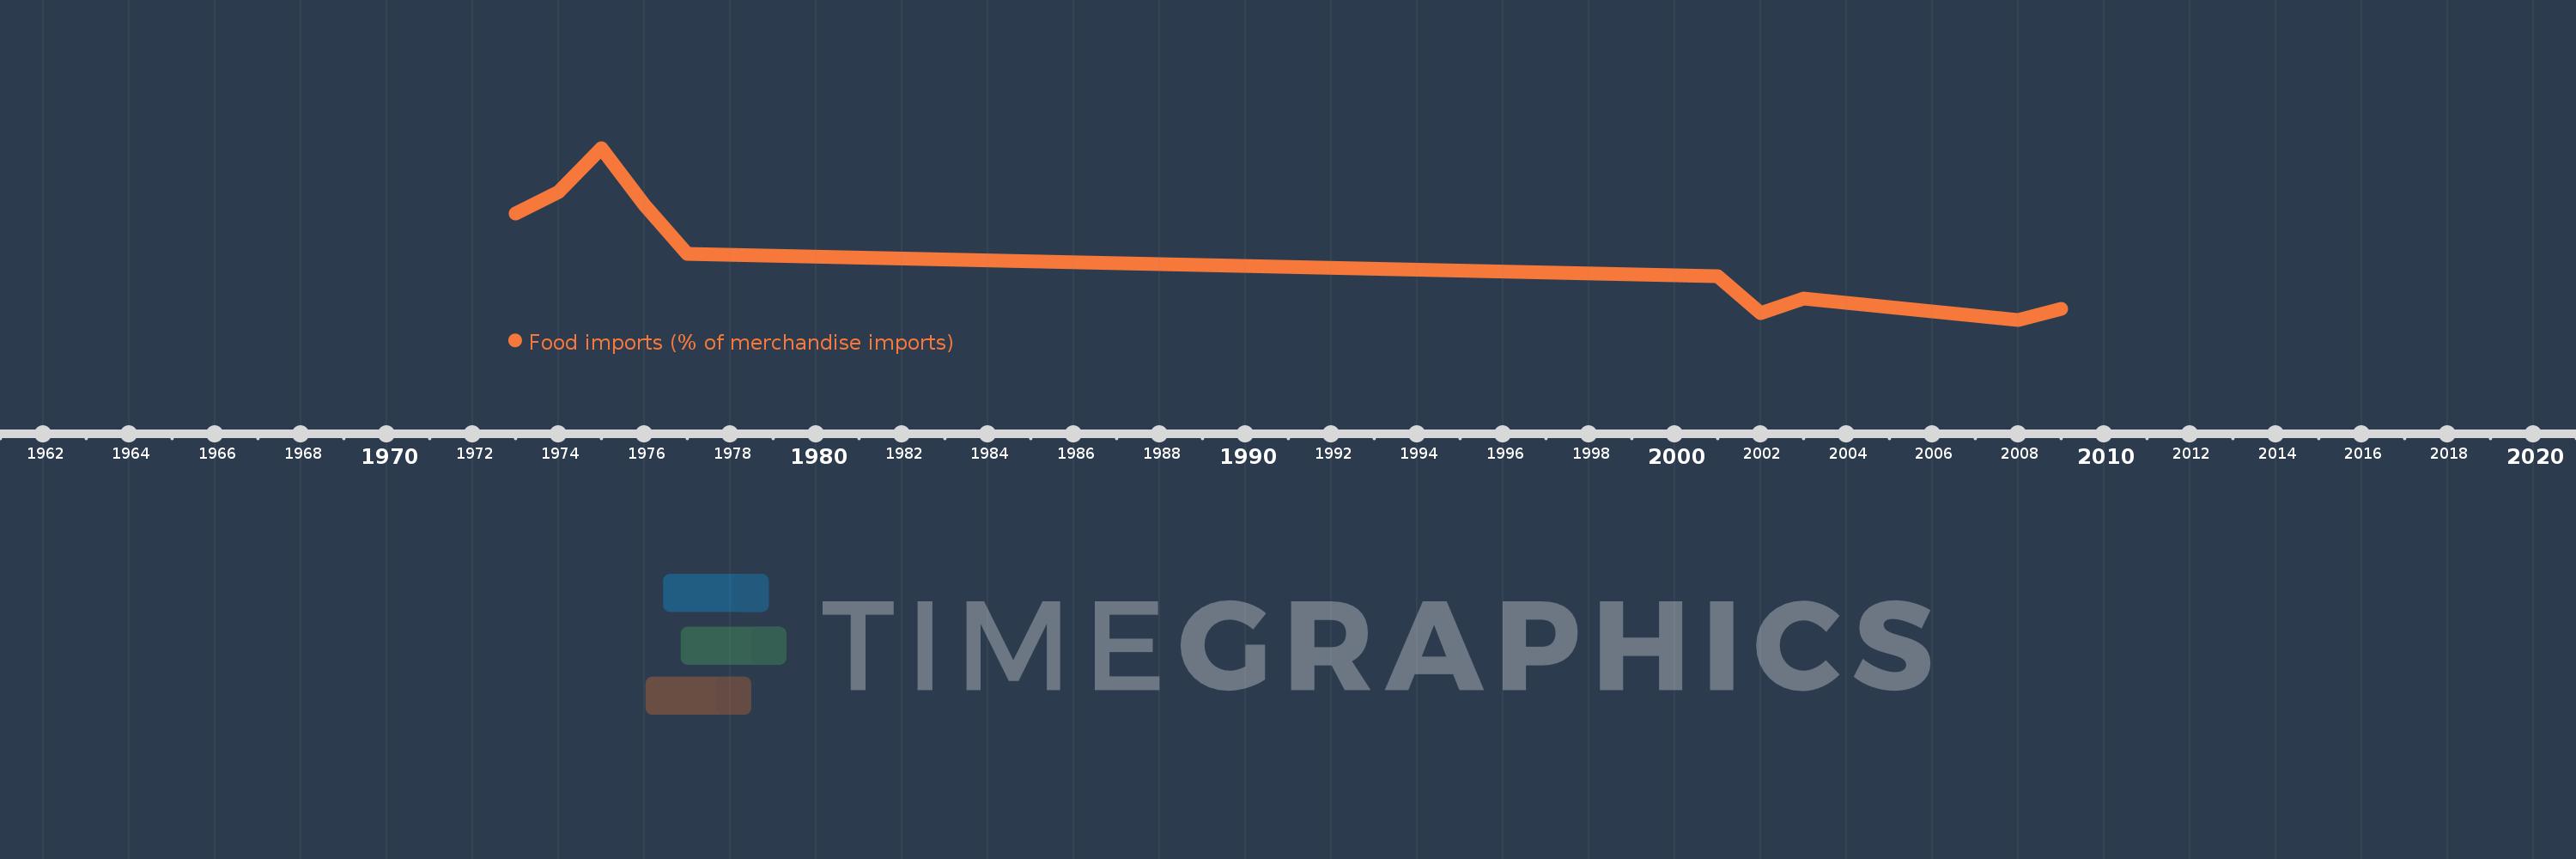
This timeline shows a graph from 1973 to 2009 of Fragile and conflict affected situations. No data until 1972. Number of actual observations by date: 10.
Source name:
World Development Indicators
Source organization:
World Bank staff estimates from the Comtrade database maintained by the United Nations Statistics Division.
Categories, topics:
Private Sector, Trade
Last updated:
apr 23, 2017
Indicators value changes by year
Meaning:
16.051
Minimum:
10.383
jan 1, 2008
Maximum:
24.935
jan 1, 1975
At the date of observation
Value
Absolute change
Change from the previous value
jan 1, 1973
19.396
+19.396
0.0%
jan 1, 1974
21.178
+1.782
9.19%
jan 1, 1975
24.935
+3.757
17.74%
jan 1, 1976
20.095
-4.84
-19.41%
jan 1, 1977
15.997
-4.097
-20.39%
jan 1, 2001
14.07
-1.927
-12.05%
jan 1, 2002
10.925
-3.145
-22.35%
jan 1, 2003
12.193
+1.268
11.61%
jan 1, 2008
10.383
-1.809
-14.84%
jan 1, 2009
11.335
+0.951
9.16%
Ranking of countries by current statistics by years