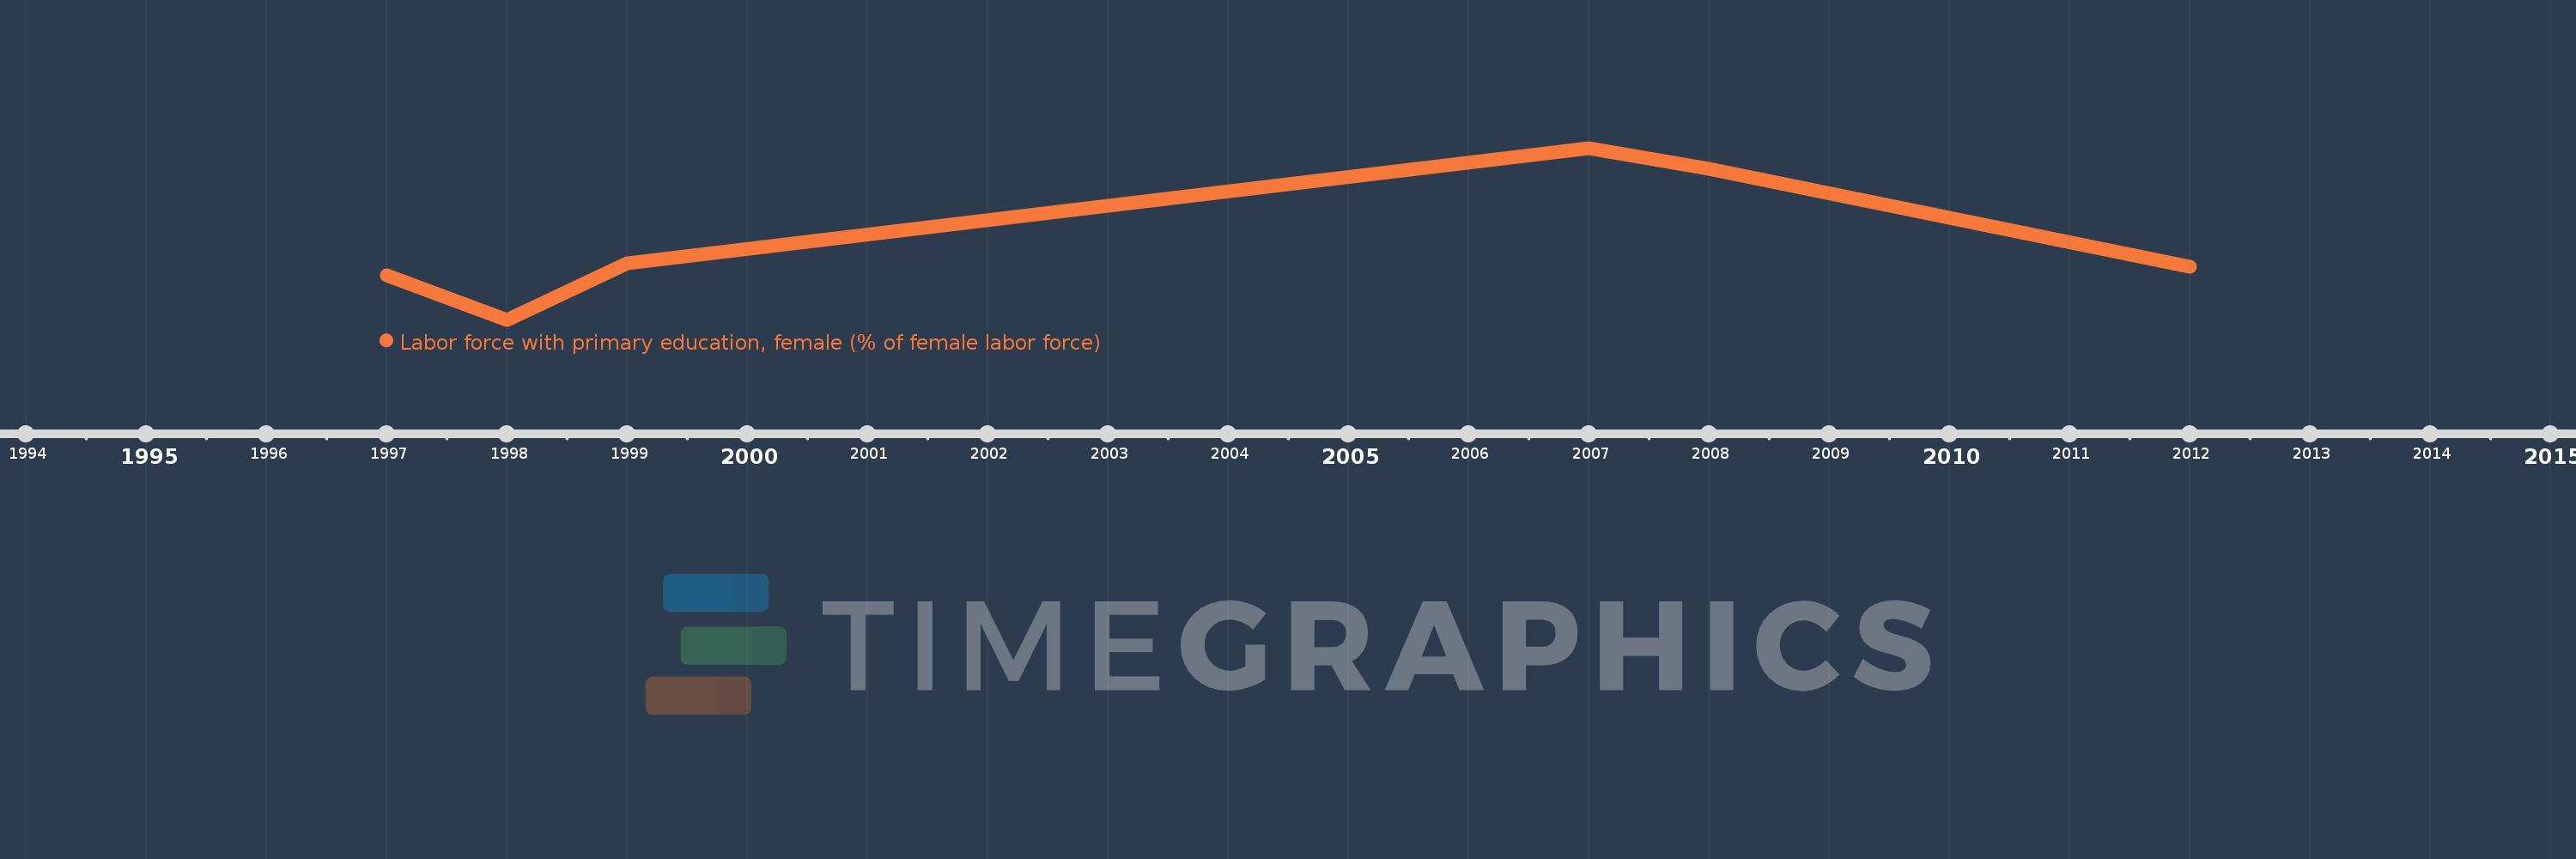
This timeline shows a graph from 1997 to 2012 of Latin America & the Caribbean (IDA & IBRD countries). No data until 1996. Number of actual observations by date: 6.
Source name:
World Development Indicators
Source organization:
International Labour Organization, Key Indicators of the Labour Market database.
Categories, topics:
Education, Social Protection & Labor, Gender
Last updated:
apr 23, 2017
Indicators value changes by year
Meaning:
31.587
Minimum:
24.029
jan 1, 1998
Maximum:
40.344
jan 1, 2007
At the date of observation
Value
Absolute change
Change from the previous value
jan 1, 1997
28.272
+28.272
0.0%
jan 1, 1998
24.029
-4.244
-15.01%
jan 1, 1999
29.411
+5.382
22.4%
jan 1, 2007
40.344
+10.933
37.17%
jan 1, 2008
38.395
-1.949
-4.83%
jan 1, 2012
29.072
-9.323
-24.28%
Ranking of countries by current statistics by years